地球の北極圏や高山地帯に広がる永久凍土は、単なる「凍った地面」ではありません。それは数万年から数十万年という膨大な時間をかけて蓄積された、地球の記憶を封じ込めた巨大な貯蔵庫です。しかし、近年の急速な気温上昇により、この安定していた氷の層が融解し始めており、それが地球全体の気候システムに深刻な連鎖反応を引き起こすことが懸念されています。
永久凍土とは何か:定義と構造
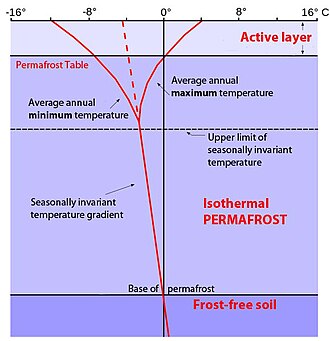
永久凍土とは、土壌や海底の堆積物が2年以上連続して0°C以下に保たれている状態を指します。その歴史は非常に古く、最古のものは約70万年もの間、凍結状態が維持されてきました。深さは場所によって大きく異なり、1メートルに満たない浅いものから、1,500メートルを超える深層まで存在します。
地表付近には、季節によって凍結と融解を繰り返す能動層(アクティブレイヤー)と呼ばれる層があり、その下に安定した永久凍土層が位置しています。地中深くでは地熱の影響を受けるため、最下層は凍結点以上に温度が上がることがあります。
分布と種類
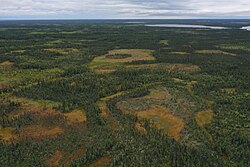
永久凍土は主に北半球の広大な地域に分布していますが、その形態は多様です。広範囲にわたって途切れなく広がる「連続的永久凍土」と、場所によって分布が断続的な「不連続的永久凍土」に分けられます。また、北極圏だけでなく、アンデス山脈やアルプス山脈などの高山地帯にも「高山永久凍土」として存在しています。
| 地域 | 推定面積 (km²) |
|---|---|
| 青蔵高原(チベット高原) | 1,300,000 |
| ハンガイ・アルタイ山脈 | 1,000,000 |
| ブルックス山脈 | 263,000 |
| シベリア山脈 | 255,000 |
| グリーンランド | 251,000 |
| ウラル山脈 | 125,000 |
| アンデス山脈 | 100,000 |
| ロッキー山脈(米・加) | 100,000 |
| アルプス山脈 | 80,000 |
| フェノスカンジア山脈 | 75,000 |
さらに、かつての氷河期に形成され、現在は海の下に存在する「海底永久凍土」という形態もあり、過去の地球環境を知る重要な手がかりとなっています。
![Changes in subsea permafrost extent and structure between the Last Glacial Maximum and 2020.[6]](/images/f2/8c/f28c369614e921da0fa10a2dd70b2ffdf819745c66d9086e1e2cb1ea1244726d.jpg)
地表に現れる永久凍土の形態
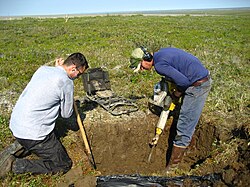
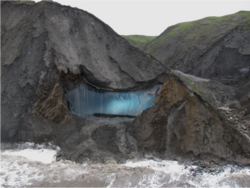
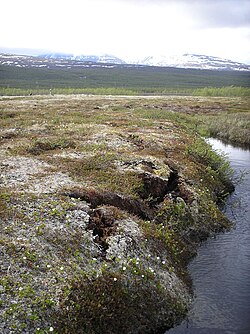
永久凍土は、地中の氷の分布や土壌の動きによって独特の地形を作り出します。特に、大量の氷が地中に埋蔵されている場合、それが融解することで地盤が沈下し、サーモカルストと呼ばれる独特の地形が形成されます。
代表的な例として、氷の丘である「ピンゴ」や、地面が多角形に割れる「ポリゴン地形」、氷が楔状に食い込む「氷楔」などが挙げられます。また、土壌がゆっくりと斜面を流れ下る「ソリフラクション(土流)」という現象も見られます。
![Labelled example of a massive buried ice deposit in Bylot Island, Canada.[54]](/images/e4/fb/e4fbd81941ad55df4fff50dfcc0668d1da11fff10d29aa69458091ccd67248c7.png)

気候変動がもたらす深刻なリスク
地球温暖化に伴い、永久凍土の融解速度が加速しています。これは単に地面が緩むという物理的な問題に留まらず、地球規模の環境リスクへと発展します。
Key Facts
- 温室効果ガスの放出: 凍土に封じ込められていた有機物が分解され、大量の二酸化炭素やメタンが放出されることで、さらなる温暖化を招く正のフィードバックが発生します。
- インフラの崩壊: 地盤の不安定化により、道路、鉄道、パイプラインなどの構造物が損壊し、甚大な経済的損失を招きます。
- 有害物質の漏出: かつて安定していた地中に埋設された毒性物質や廃棄物が、融解に伴い外部へ漏れ出す危険性があります。
- 未知の病原体の復活: 数万年前のウイルスや細菌が凍土から目覚め、現代の生態系に影響を与える可能性が研究されています。
環境へのフィードバックループ
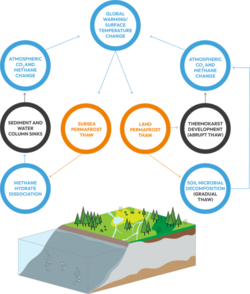
特に懸念されるのが、炭素サイクルへの影響です。永久凍土の泥炭地などは膨大な炭素を蓄えており、これが融解して微生物に分解されると、強力な温室効果ガスであるメタンなどが放出されます。これにより気温がさらに上昇し、さらに凍土が溶けるという悪循環に陥ります。
![Permafrost peatlands (a smaller, carbon-rich subset of permafrost areas) under varying extent of global warming, and the resultant emissions as a fraction of anthropogenic emissions needed to cause that extent of warming.[86]](/images/09/b3/09b3b504f9ac97438d1bf0492f764404dcb2af5d175d9ca3515df170042464e5.jpg)
![Permafrost thaw ponds on peatland in Hudson Bay, Canada in 2008.[98]](/images/c6/60/c6602ed89bcf960be4d57f8c03d6ae5a898b3efe6e19ccc8a0e240869b7c4561.jpg)
![Nine probable scenarios of greenhouse gas emissions from permafrost thaw during the 21st century, which show a limited, moderate and intense CO2 and CH4 emission response to low, medium and high-emission Representative Concentration Pathways. The vertical bar uses emissions of selected large countries as a comparison: the right-hand side of the scale shows their cumulative emissions since the start of the Industrial Revolution, while the left-hand side shows each country's cumulative emissions for the rest of the 21st century if they remained unchanged from their 2019 levels.[11]](/images/1d/03/1d030de201ee1b9a410aa2c7faafbe929bfb2351c3245891635ea78a7d1b4a87.jpg)
社会基盤への直接的な打撃
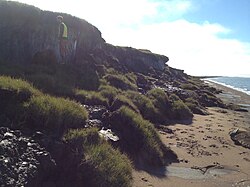
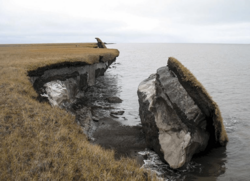
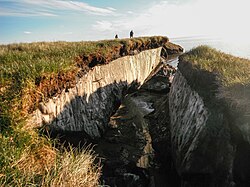
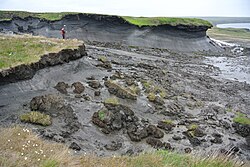
北極圏の沿岸部では、永久凍土の融解による地盤弱体化と波の浸食が同時に起こり、激しい海岸侵食が発生しています。また、内陸部でも地盤沈下により建物やインフラが傾く現象が多発しており、2050年までに多くの地域でリスクが高まると予測されています。
![Map of likely risk to infrastructure from permafrost thaw expected to occur by 2050.[114]](/images/2c/ad/2cadc1330cc5c473bdf261bd2133ac2ccef69638c0ac8f27000dc61b3a8f8e5f.png)
![Detailed map of Qinghai–Tibet Plateau infrastructure at risk from permafrost thaw under the SSP2-4.5 scenario.[121]](/images/24/0b/240b6174dd8522d824f69bf3645581c39d9b1e8ddba54eaa0e728a6fcc8864e7.png)
生物学的・化学的リスク
凍土の融解は、化学的な汚染物質の流出を招くだけでなく、生物学的なリスクも孕んでいます。研究チームによって、数万年前のアメーバを食べるウイルスなどが復活させられており、古代の微生物が再び活性化することへの警戒が高まっています。
![Graphical representation of leaks from various toxic hazards caused by the thaw of formerly stable permafrost.[14]](/images/e7/ee/e7ee495203aeba570c1858a80d45d14918ce030bad5830fa635719e5b51b0dd4.png)
![Distribution of toxic substances currently located at various permafrost sites in Alaska, by sector. The number of fish skeletons represents the toxicity of each substance.[14]](/images/33/44/334433ee413bebc513dfa3bfb65f8e1c74339f932354116b7666e15527999b2c.png)
![Some of the ancient amoeba-eating viruses revived by the research team of Jean-Michel Claverie. Clockwise from the top: Pandoravirus yedoma; Pandoravirus mammoth and Megavirus mammoth; Cedratvirus lena; Pithovirus mammoth; Megavirus mammoth; Pacmanvirus lupus.[17]](/images/4c/7d/4c7da95795a6acae36d2ffd9d0cc029c906fc60cbda6eebc2942ff1bcdd57534.jpg)
科学研究の進展と歴史
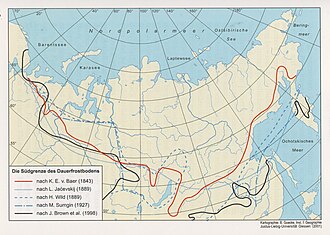
永久凍土の研究は、古くは19世紀のカール・エルンスト・フォン・ベールらの研究に遡ります。当時は分布の特定が主目的でしたが、現代では気候変動との関連性が最重要課題となっています。
特に1990年代以降、「永久凍土」と「炭素」をキーワードとする論文数は爆発的に増加しており、地球温暖化のメカニズムを解明するための不可欠な研究分野として確立されました。
![The annual number of scientific research papers published on the subject of permafrost carbon has grown from next to nothing around 1990 to around 400 by 2020.[11]](/images/95/79/95799ae33b4ae48c82e3bf205b7bab101e24003da2d6599f9adc3db4a70b290f.jpg)
Frequently Asked Questions
永久凍土が溶けると、なぜ温暖化が加速するのですか?
永久凍土の中には、太古の植物などの有機物が凍ったまま保存されています。凍土が溶けると、これらの有機物が微生物によって分解され、二酸化炭素やメタンなどの温室効果ガスとして大気中に放出されるため、温暖化がさらに促進されます。
「能動層」とは具体的にどのような場所ですか?
永久凍土の最上層に位置し、夏には融解し、冬には再び凍結するというサイクルを毎年繰り返す土壌層のことです。この層の厚さが年々増していることが、温暖化の指標の一つとなっています。
古代のウイルスが復活して人間への脅威になることはありますか?
実際に数万年前のウイルスが研究によって復活した例はありますが、多くはアメーバなどの特定の生物に感染するものです。ただし、未知の病原体が環境中に放出されるリスクについては、科学的な監視と研究が続けられています。
インフラへの影響で最も深刻なのはどのようなケースですか?
地盤を支えていた氷が溶けることで、地面が不均一に沈下する現象です。これにより、パイプラインの破断による燃料漏れや、道路の陥没、建物の傾きなど、物理的な構造破壊が深刻な問題となっています。
References
- McGee, David; Gribkoff, Elizabeth (4 August 2022). "Permafrost". MIT Climate Portal. Retrieved 27 September 2023.
- "What is Permafrost?". International Permafrost Association. Retrieved 27 September 2023.
- Denchak, Melissa (26 June 2018). "Permafrost: Everything You Need to Know". . Retrieved 27 September 2023.
- Cooper, M. G.; Zhou, T.; Bennett, K. E.; Bolton, W. R.; Coon, E. T.; Fleming, S. W.; Rowland, J. C.; Schwenk, J. (4 January 2023). "Detecting Permafrost Active Layer Thickness Change From Nonlinear Baseflow Recession". Water Resources Research. 57 (1) e2022WR033154. :2023WRR....5933154C. :10.1029/2022WR033154. 255639677.
- Obu, J. (2021). "How Much of the Earth's Surface is Underlain by Permafrost?". Journal of Geophysical Research: Earth Surface. 126 (5) e2021JF006123. :2021JGRF..12606123O. :10.1029/2021JF006123.
- Sayedi, Sayedeh Sara; Abbott, Benjamin W.; Thornton, Brett F.; Frederick, Jennifer M.; Vonk, Jorien E.; Overduin, Paul; Schädel, Christina; Schuur, Edward A. G.; Bourbonnais, Annie; Demidov, Nikita; Gavrilov, Anatoly (22 December 2020). "Subsea permafrost carbon stocks and climate change sensitivity estimated by expert assessment". . 15 (12): B027-08. :2020AGUFMB027...08S. :10.1088/1748-9326/abcc29. :10852/83674. 234515282.
- Schuur, T. (22 November 2019). "Permafrost and the Global Carbon Cycle". – via .
- Koven, Charles D.; Ringeval, Bruno; Friedlingstein, Pierre; Ciais, Philippe; Cadule, Patricia; Khvorostyanov, Dmitry; Krinner, Gerhard; Tarnocai, Charles (6 September 2011). "Permafrost carbon-climate feedbacks accelerate global warming". . 108 (36): 14769–14774. :2011PNAS..10814769K. :10.1073/pnas.1103910108. 3169129. 21852573.
- Galera, L. A.; Eckhardt, T.; Beer C., Pfeiffer E.-M.; Knoblauch, C. (22 March 2023). "Ratio of in situ CO2 to CH4 production and its environmental controls in polygonal tundra soils of Samoylov Island, Northeastern Siberia". Journal of Geophysical Research: Biogeosciences. 128 (4) e2022JG006956. :2023JGRG..12806956G. :10.1029/2022JG006956. 257700504.
- Fox-Kemper, B.; H. T. Hewitt, C. Xiao, G. Aðalgeirsdóttir, S. S. Drijfhout, T. L. Edwards, N. R. Golledge, M. Hemer, R. E. Kopp, G. Krinner, A. Mix, D. Notz, S. Nowicki, I. S. Nurhati, L. Ruiz, J.-B. Sallée, A. B. A. Slangen, and Y. Yu, 2021: Chapter 9: Ocean, Cryosphere and Sea Level Change. In Climate Change 2021: The Physical Science Basis. Contribution of Working Group I to the Sixth Assessment Report of the Intergovernmental Panel on Climate Change [Masson-Delmotte, V.; P. Zhai, A. Pirani, S.L. Connors, C. Péan, S. Berger, N. Caud, Y. Chen, L. Goldfarb, M. I. Gomis, M. Huang, K. Leitzell, E. Lonnoy, J. B. R. Matthews, T. K. Maycock, T. Waterfield, O. Yelekçi, R. Yu, and B. Zhou (eds.)]. Cambridge University Press, Cambridge, United Kingdom and New York, USA, pp. 1211–1362.
📸 フォトギャラリー