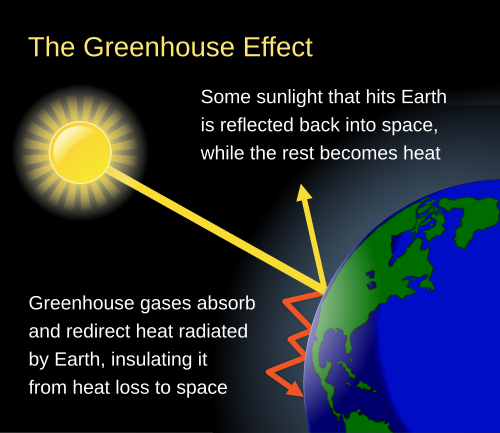
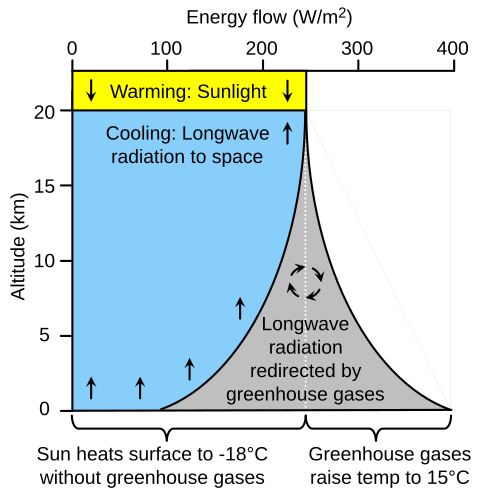
地球が生命を育む適度な温度を維持できているのは、大気中に存在する特定のガスが熱を逃がさないようにする温室効果という現象があるためです。もしこの仕組みがなければ、地球の平均表面温度は氷点下18度まで下がり、現在のような豊かな生態系は存在しなかったでしょう。しかし、現代では人間活動によるガスの増加がこのバランスを崩し、急速な気温上昇を招いています。
基本的な仕組みは、太陽からのエネルギーが地球に届き、それが地表で吸収されて熱となり、再び宇宙へ放出される過程にあります。このとき、大気中の温室効果ガスが放出される熱(長波放射)を吸収し、再び地表へ戻すことで温度を底上げしています。
Key Facts
- 温度上昇への寄与: 自然な温室効果により、地球の表面温度は約33°C上昇している。
- 放射の特性: 太陽は短波放射(可視光など)を出し、地球は長波放射(赤外線)を放出する。
- 現状の温暖化: 産業革命以降、地球の平均気温は約1.2°C上昇した(2023年時点)。
- エネルギーの不均衡: 地表から放出される長波放射のうち、約40%が宇宙に到達せず大気に留まっている。
熱放射の原理と温室効果の仕組み
絶対零度以上の温度を持つすべての物体は、その温度に応じた熱放射(電磁波としてのエネルギー放出)を行います。太陽は表面温度が約5,500°Cと極めて高いため、主に近赤外線や可視光線といった「短波放射」を放出します。一方、地球の表面温度は低いため、中赤外線から遠赤外線にかけての「長波放射」を放出します。
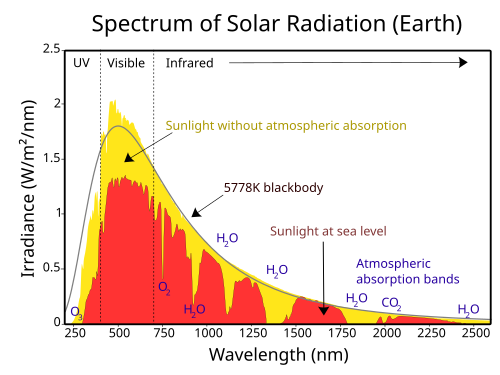
大気は太陽からの短波放射の約23%しか吸収せず、多くを地表へ通します。しかし、地表から放出される長波放射に対しては、温室効果ガスが約90%を吸収します。これにより、熱が宇宙空間へ逃げる速度が遅くなり、地表付近にエネルギーが蓄積されることになります。
温室効果ガスの役割
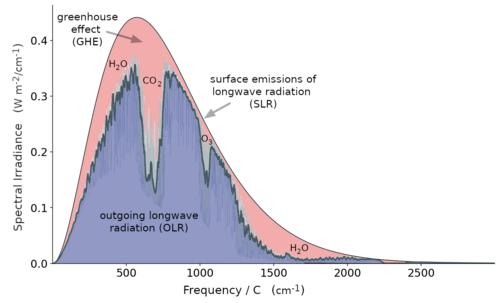
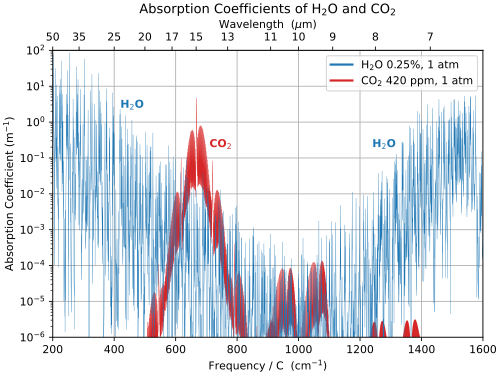
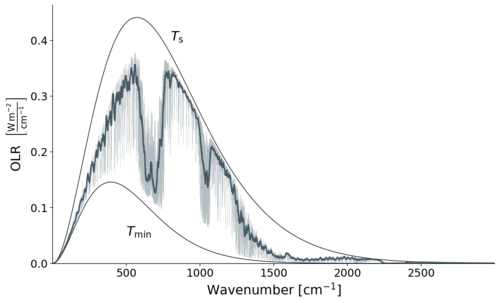
水蒸気や二酸化炭素(CO2)などのガスは、特定の波長の赤外線を吸収する性質を持っています。特にCO2は、地表が強く放射する15ミクロン付近の波長において非常に高い吸収係数を持っており、効率的に熱を捕捉します。
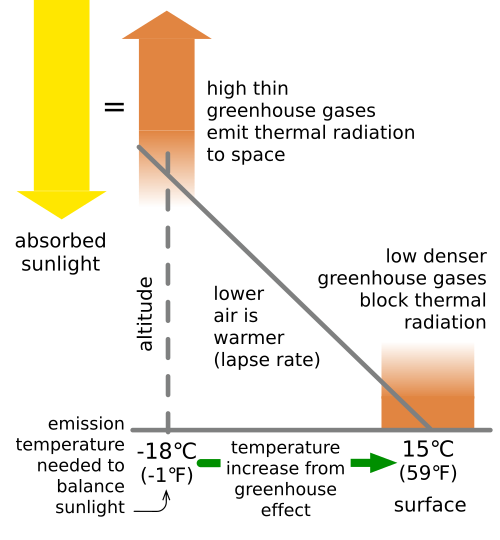
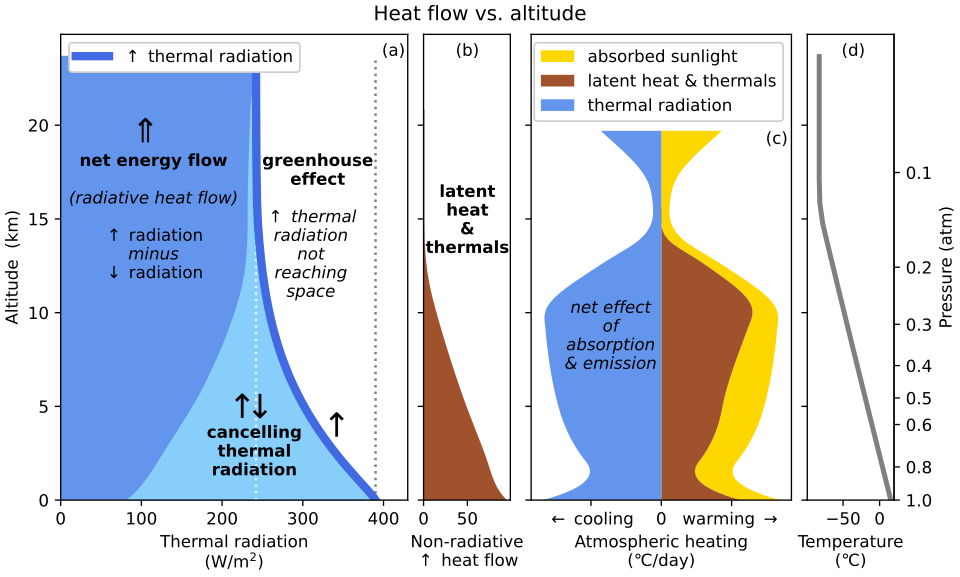
高度が上がるにつれて空気は希薄になり、温度も低下します。高層にある温室効果ガスは、地表付近よりも低い温度で宇宙へ放射を行うため、地表から放出された熱がそのまま宇宙へ抜けるのを妨げる「蓋」のような役割を果たします。
地球のエネルギー収支と測定
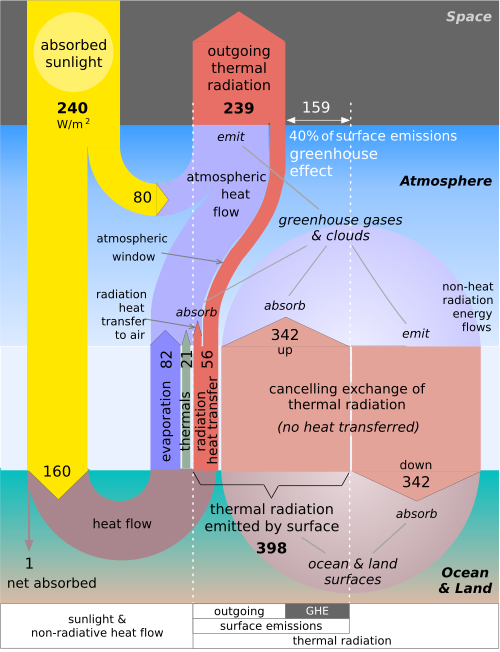
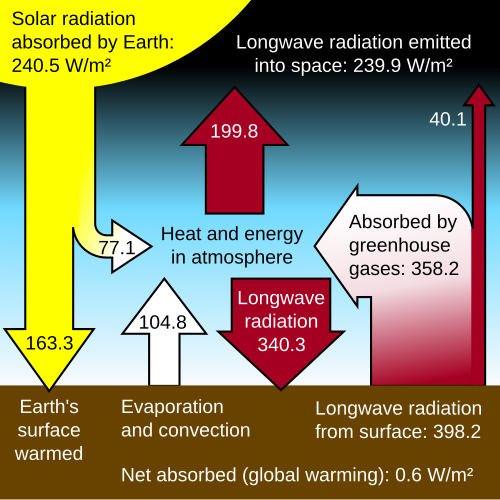
地球の温度は、太陽から受け取るエネルギー(入射)と、宇宙へ放出するエネルギー(出射)のバランスで決まります。現在、地表からは平均して398 W/m²の長波放射が出ていますが、実際に宇宙まで到達するのは239 W/m²に過ぎません。この差である159 W/m²が温室効果によって留められているエネルギー量であり、割合にすると約40%に相当します。
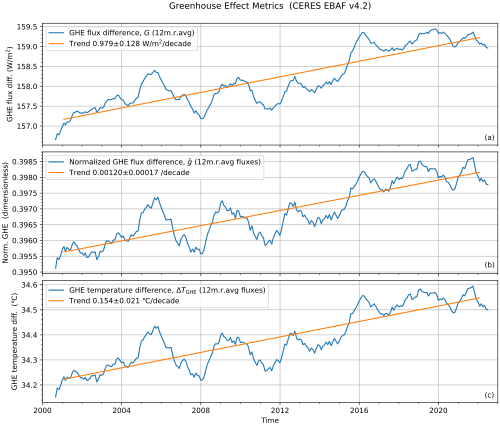
近年、NASAのCERES衛星データなどの観測により、このエネルギーの不均衡(エネルギー・インバランス)が21世紀に入って拡大していることが判明しています。これは、大気中の温室効果ガス濃度が高まり、冷却効率が低下していることを意味します。
![Earth's energy imbalance has increased in the 21st century, reaching values twice that of prior estimates from the IPCC.[50] The ability to observe this imbalance is deteriorating because satellites are being decommissioned.[50]](/images/0a/75/0a7585c35077b99ce72864b0dfef9528568a7c883d01e5c60e63799e24d3daab.webp)
温度と放射の関係
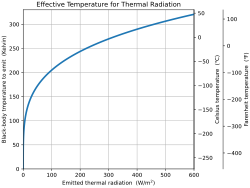
物体が放出する放射エネルギーの強さは、温度の4乗に比例します。この物理的特性により、わずかなエネルギー収支の変化が地表温度に大きな影響を与えます。また、放射されるエネルギーの強度を黒体放射曲線と比較することで、どの高度でどの程度の温度の放射が行われているかを特定することが可能です。
惑星間での比較:極端な事例
温室効果の強さは惑星によって大きく異なります。最も顕著な例が金星です。金星は地球より太陽に近いですが、それ以上に大気の97%を占める二酸化炭素による猛烈な温室効果が影響しています。その結果、表面温度は462°Cという極限状態に達しています。
かつての金星には海があったと考えられていますが、「暴走温室効果」によって水がすべて蒸発し、現在の高圧で高温な環境になったという説が有力です。対照的に火星は、大気が極めて薄いため温室効果が弱く、表面温度は非常に低くなっています。
![Comparison of Earth's upward flow of longwave radiation in reality and in a hypothetical scenario in which greenhouse gases and clouds are removed or lose their ability to absorb longwave radiation—without changing Earth's albedo (i.e., reflection/absorption of sunlight). Top shows the balance between Earth's heating and cooling as measured at the top of the atmosphere (TOA). Panel (a) shows the real situation with an active greenhouse effect.[56] Panel (b) shows the situation immediately after absorption stops; all longwave radiation emitted by the surface would reach space; there would be more cooling (via longwave radiation emitted to space) than warming (from sunlight). This imbalance would lead to a rapid temperature drop. Panel (c) shows the final stable steady state, after the surface cools sufficiently to emit only enough longwave radiation to match the energy flow from absorbed sunlight.[56]](/images/26/c9/26c9f8f9f4dd3cf9e92c1cc3cc462edd10cdece316aa53d13c302cf3d67e3135.webp)
| 惑星 | 観測表面温度 | 温室効果による温度上昇 (ΔT) | 主成分ガス | 大気圧 |
|---|---|---|---|---|
| 金星 | 462 °C | 503 K | CO2 (96.5%) | 92 atm |
| 地球 | 15 °C | 33 K | N2, O2 | 1 atm |
| 火星 | -58 °C | 6 K | CO2 (95%) | 0.0063 atm |
| タイタン | -179 °C | 12 K | N2, CH4 | 1.5 atm |
気候変動への影響と経済的リスク
化石燃料の燃焼により、大気中の二酸化炭素やメタンの濃度が上昇し、自然な温室効果が「強化」されています。1981年以降、地球の平均表面温度は10年あたり約0.18°Cのペースで上昇し続けています。
この温暖化の影響は線形ではなく、蓄積された温室効果ガスによる被害は時間の経過とともに加速します。ある研究では、60年間にわたる経済的損失は、30年間の損失の5倍以上に達すると推定されており、過去の排出が将来的に甚大な被害をもたらすリスクが指摘されています。
![Non-linear growth in the global warming effect of accumulating long-lived greenhouse gases contributed to economic damages over a 60-year period estimated to be over five times as large as that of a 30-year period (shown in chart). A Nature article estimated future damages from past emissions to be at least an order of magnitude larger than historical damages from the same emissions.[30]](/images/52/22/5222ac8ae150e5abbc628716a63bc819e6c14b3462d5ddbf870534187026bf62.webp)
地球全体の熱の流れは、常に高温から低温へと移動するという熱力学第二法則に従っています。しかし、大気による「冷却効率の低下」がこの流れを阻害し、地球というシステム全体のエネルギーバランスを崩しているのが現状です。
![Earth's overall heat flow. Heat (net energy) always flows from warmer to cooler, honoring the second law of thermodynamics.[79] (This heat flow diagram is equivalent to NASA's earth energy budget diagram. Data is from 2009.)](/images/f9/59/f959dac6e40d69e0db0191b9165962cc102246f05ec9c71a6a3471ed47675819.webp)
Frequently Asked Questions
温室効果はもともと悪いものなのですか?
いいえ、温室効果自体は地球に不可欠な自然現象です。もし温室効果が全くなかったら、地球の平均気温はマイナス18度になり、多くの生物が生存できない環境になります。問題は、人間活動によってその効果が強まりすぎ、急激な温暖化が起きていることです。
なぜ二酸化炭素が温室効果ガスとして注目されるのですか?
二酸化炭素は、地表から放出される赤外線の特定の波長を非常に効率よく吸収する性質を持っているためです。また、大気中に長く留まる性質があるため、排出された分が蓄積し続け、長期的に地球の温度を押し上げる要因となります。
金星は太陽に近いから暑いだけではないのですか?
太陽からの距離も影響していますが、主因は極めて濃い二酸化炭素の大気による温室効果です。実際、金星は太陽光の多くを反射しているため、温室効果がなければ表面温度はマイナス41度程度になっていたと推定されています。
「エネルギー・インバランス」とは具体的にどういう状態ですか?
地球が太陽から受け取るエネルギー量よりも、宇宙へ放出するエネルギー量の方が少なくなっている状態を指します。この差分が地球に蓄積されるため、海水の温度上昇や氷河の融解といった形で温暖化が進みます。
水蒸気も温室効果ガスに含まれますか?
はい、水蒸気は非常に強力な温室効果ガスの一つです。1856年には、乾燥した空気よりも水蒸気を含む空気の方が太陽による加熱効果が高いことが実証されています。水蒸気は温度が上がるとさらに増えるため、温暖化を加速させるフィードバックとして作用します。
References
- "Solar Radiation and the Earth's Energy Balance". The Climate System – EESC 2100 Spring 2007. Columbia University. Archived from the original on 4 November 2004. Retrieved 15 October 2010.
- Le Treut H, Somerville R, Cubasch U, Ding Y, , Mokssit A, Peterson T, Prather M (2007). "Historical Overview of Climate Change Science" (PDF). In Solomon S, Qin D, Manning M, Chen Z, Marquis M, Averyt KB, Tignor M, Miller HL (eds.). Climate Change 2007: The Physical Science Basis. Contribution of Working Group I to the Fourth Assessment Report of the Intergovernmental Panel on Climate Change. Cambridge, UK and New York, NY: Cambridge University Press. p. 97. Archived from the original (PDF) on 26 November 2018. Retrieved 25 March 2014.
- "The Elusive Absolute Surface Air Temperature (SAT)". . . Archived from the original on 5 September 2015. Retrieved 3 September 2008.
- "Yearly average temperature". Climate Change Tracker.
- A concise description of the greenhouse effect is given in the Intergovernmental Panel on Climate Change Fourth Assessment Report, "What is the Greenhouse Effect?" FAQ 1.3 – AR4 WGI Chapter 1: Historical Overview of Climate Change Science Archived 5 August 2019 at the , IIPCC Fourth Assessment Report, Chapter 1, page 115: "To balance the absorbed incoming [solar] energy, the Earth must, on average, radiate the same amount of energy back to space. Because the Earth is much colder than the Sun, it radiates at much longer wavelengths, primarily in the infrared part of the spectrum (see Figure 1). Much of this thermal radiation emitted by the land and ocean is absorbed by the atmosphere, including clouds, and reradiated back to Earth. This is called the greenhouse effect."
Schneider, Stephen H. (2001). "Global Climate Change in the Human Perspective". In Bengtsson, Lennart O.; Hammer, Claus U. (eds.). Geosphere-biosphere Interactions and Climate. Cambridge University Press. pp. 90–91. . Archived from the original on 2 August 2020. Retrieved 31 May 2018.
Claussen, E.; Cochran, V.A.; Davis, D.P., eds. (2001). "Global Climate Data". Climate Change: Science, Strategies, & Solutions. University of Michigan. p. 373. . Archived from the original on 18 May 2020. Retrieved 1 June 2018.
Allaby, A.; Allaby, M. (1999). A Dictionary of Earth Sciences. Oxford University Press. p. 244. . - Rebecca, Lindsey (14 January 2009). "Climate and Earth's Energy Budget : Feature Articles". earthobservatory.nasa.gov. Archived from the original on 21 January 2021. Retrieved 14 December 2020.
- "AR6 Synthesis Report: Summary for Policymakers Headline Statements". www.ipcc.ch. Retrieved 8 May 2026.
- Fox, Alex. "Atmospheric Carbon Dioxide Reaches New High Despite Pandemic Emissions Reduction". Smithsonian Magazine. Archived from the original on 10 June 2021. Retrieved 22 June 2021.
- Lindsey, Rebecca; Dahlman, Luann. "Climate Change: Global Temperature". NOAA Climate.gov. Archived from the original on 15 June 2013.
- "What is Earth's Energy Budget? Five Questions with a Guy Who Knows". NASA.gov. 10 April 2017. Retrieved 24 April 2023.
📸 フォトギャラリー