地球上のあらゆる生命活動や気候システムを動かす最大のエネルギー源は、太陽から降り注ぐ電磁波です。このエネルギーの強さを定量的に表したものが太陽放射強度(Solar Irradiance)です。これは単位面積あたりに届く電力(表面電力密度)を指し、国際単位系(SI)ではワット毎平方メートル(W/m²)で測定されます。
一方で、ある一定期間にわたって蓄積された放射エネルギーの総量は日射量(Solar Irradiation/Insolation)と呼ばれ、ジュール毎平方メートル(J/m²)などで表記されます。この二つの概念を区別することは、気候変動の解析や太陽光発電の設計において極めて重要です。
Key Facts
- 太陽放射強度は単位面積あたりの瞬時的な電力(W/m²)を指し、日射量は時間積分された総エネルギー量を指す。
- 地球大気圏外に届く平均的な太陽放射強度は約1361 W/m²である。
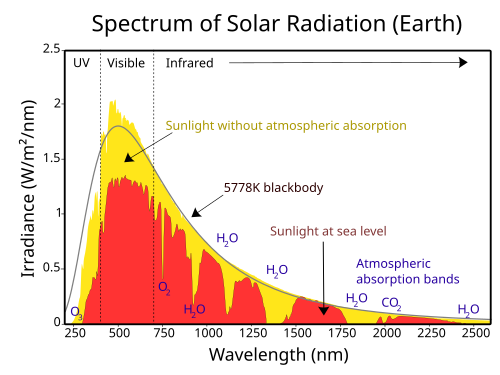
- 地表に届くエネルギーは、大気による吸収や散乱、および太陽の入射角(投影効果)によって減少する。
- 地球の公転軌道の変化(ミリコビッチ・サイクル)は、長期的な気候変動や氷河期に影響を与える。
- 太陽光パネルの発電効率は、設置角度を最適化することで、高緯度地域でも最大限に引き出すことが可能である。
大気圏外における太陽エネルギーの挙動
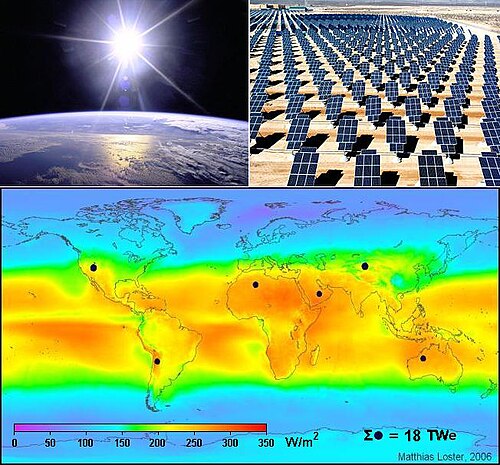
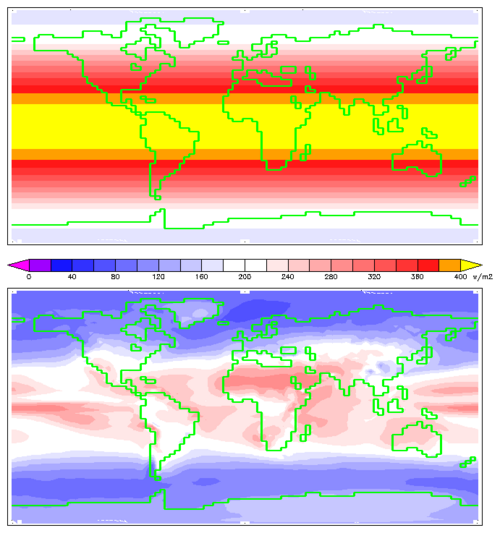
地球の大気圏外、つまり宇宙空間に届く太陽エネルギーの平均値は約1361 W/m²とされています。これは太陽から地球までの平均距離(1天文単位:AU)にある仮想的な球面上での電力密度です。地球という球体が太陽に向ける断面積でこのエネルギーを受けるため、地球全体の表面積で平均化すると、数値は4分の1の約340 W/m²となります。この数値は、地球のエネルギー収支を決定する放射強制力を計算する際の基礎となります。
太陽放射強度の変動要因
太陽からのエネルギー出力は完全に一定ではありません。数十年のスパンで変動する太陽サイクル(太陽活動周期)により、全太陽放射強度(TSI)はわずかに増減します。例えば、サイクル21における変動幅は約0.1%でした。また、波長によって変動率が異なり、紫外線(EUV)領域では極大期と極小期で約1.5%の変動が見られます。
軌道要素による影響(ミリコビッチ・サイクル)
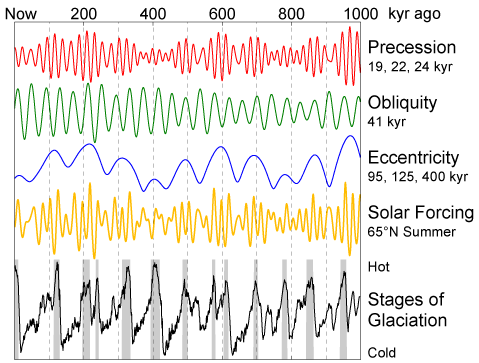
エネルギーの変化は太陽側だけでなく、地球側の要因でも起こります。地球の公転軌道が楕円であるため、近日点と遠日点での距離が変わり、エネルギーフラックスに差が生じます。さらに、地軸の傾きや歳差運動などのミリコビッチ・サイクルと呼ばれる軌道変動は、数万年単位で地域的な日射量を最大25%も変化させ、氷河期のサイクルなどの長期的な気候変動を引き起こす要因となります。
地表における日射の特性と測定
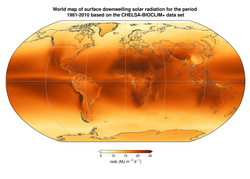
大気圏外から届いたエネルギーは、大気層を通過する際に吸収や散乱を受けます。快晴の日の海抜0メートル地点では、太陽が天頂にある時の最大法線面日射強度は約1000 W/m²まで減衰します。地表で観測される放射には、太陽から直接届く「直達日射」と、大気で散乱して届く「散乱日射」があり、これらを合わせたものが全天日射量(GHI)となります。
![Global map of global horizontal radiation[5]](/images/ce/ef/ceefe8be498054d25a24edda2df568514e4b2a436692ca77ef53758824426122.png)
![Global Map of Direct Normal Radiation[5]](/images/b1/2a/b12a87fa4be02f64004f0f9fbaaf8556bc63878ad33a612b8dfab344ccf168e5.png)
投影効果と入射角の影響
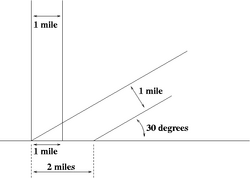
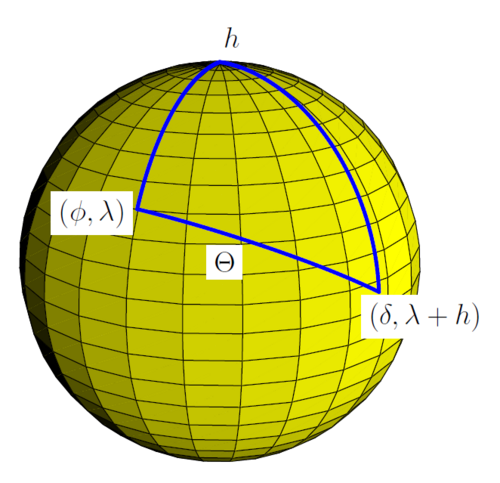
地表に届くエネルギー量は、太陽の高度(入射角)に強く依存します。これを投影効果と呼びます。太陽光が地面に対して垂直に降り注ぐ場合と比べて、角度が浅くなると光がより広い面積に分散されるため、単位面積あたりのエネルギー密度は低下します。
精密な測定手法
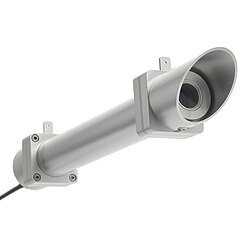
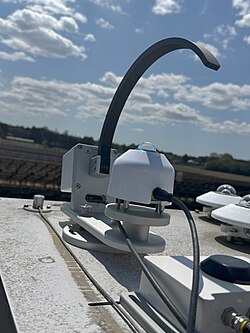
日射の測定には、用途に応じて異なる計器が使用されます。全天日射量を測定する日射計(Pyranometer)や、太陽を追尾して直達日射のみを測定する直達日射計(Pyrheliometer)が代表的です。また、最新の衛星観測(SORCE/TIMなど)では、散乱光による誤差を排除した極めて精度の高いTSI測定が行われており、地球のエネルギー不均衡の解明に寄与しています。

実社会への応用と影響
太陽光発電の最適化
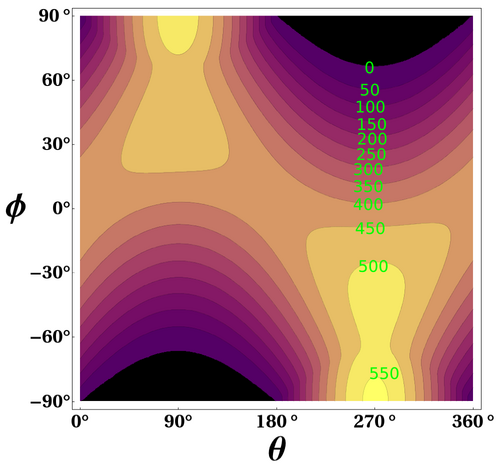
太陽光パネルを設置する際、水平に置くのではなく太陽に向けて傾斜をつけることで、冬場の不足分を補い、年間を通じて効率的に発電できます。興味深いことに、適切に傾斜角を調整すれば、高緯度地域であっても赤道付近に匹敵するエネルギーを回収できる場合があります。例えば、北極や南極の夏至の日には、24時間降り注ぐ太陽光により、水平面での日射量が赤道の春分の日を上回ることがあります。
建築と気候研究への活用
日射強度のデータは、パッシブデザインなどの建築設計や、土木工学における熱解析に利用されます。また、最新の研究では、太陽放射を効率的に反射させることで、外部電力を消費せずに地表温度を下げる受動的昼間放射冷却という技術の開発が進んでおり、地球温暖化対策としての期待が集まっています。
日射ポテンシャルの地域差
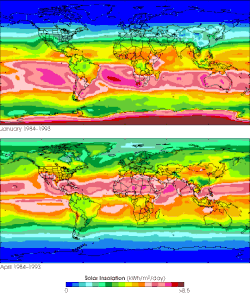
世界各地で日射量は大きく異なります。サハラ以南のアフリカやラテンアメリカ、オーストラリアなどは非常に高い日射ポテンシャルを持っており、再生可能エネルギー導入の適地とされています。
| 指標 | 定義・意味 | 代表的な値・単位 |
|---|---|---|
| 太陽放射強度 (Irradiance) | 単位面積あたりの瞬時電力 | W/m² |
| 日射量 (Insolation) | 一定期間の累積放射エネルギー | J/m² または kWh/m² |
| 太陽定数 (Solar Constant) | 大気圏外での平均放射強度 | 約1361 W/m² |
| 全天日射量 (GHI) | 直達日射 + 散乱日射の合計 | 地表で最大 約1000-1120 W/m² |
Frequently Asked Questions
太陽放射強度と日射量の違いは何ですか?
太陽放射強度は「今この瞬間」にどれだけのパワーが届いているかという「密度(W/m²)」を指します。対して日射量は、その強度を1日や1年といった「時間で合計(積分)」したエネルギーの総量(J/m²やkWh/m²)を指します。
なぜ地域や季節によって日射量が変わるのですか?
主な要因は、地球が球体であることと、地軸が傾いたまま公転していることです。これにより、太陽光が地表に届く角度(入射角)が変化し、同じエネルギー量でも照射される面積が変わるため、単位面積あたりの強度が変動します。
大気は太陽エネルギーにどのような影響を与えますか?
大気中のガスや粒子が太陽光を吸収したり、四方八方に散乱させたりします。これにより、宇宙空間で測定される強度よりも地表に届く強度は低下しますが、同時に散乱光によって日陰であってもある程度の明るさが確保されます。
太陽活動の変動は地球の気温にどの程度影響しますか?
太陽サイクルの変動による全太陽放射強度(TSI)の変化はわずか0.1%程度ですが、これが放射強制力として作用し、地球の気温に影響を与えます。最新の研究では、このわずかな変動が海洋の熱吸収などのプロセスを通じて気候応答を引き起こすと考えられています。
太陽光パネルを傾けるメリットは何ですか?
パネルを太陽に対して垂直に近い角度で設置することで、投影効果によるエネルギー損失を最小限に抑えられます。これにより、特に太陽高度が低い冬場や高緯度地域において、水平設置よりも大幅に多くの電力を得ることが可能になります。
References
- Brun, P.; Zimmermann, N.E.; Hari, C.; Pellissier, L.; Karger, D.N. "Global climate-related predictors at kilometre resolution for the past and future". Earth Syst. Sci. Data. :10.5194/essd-2022-212.
- Michael Boxwell, Solar Electricity Handbook: A Simple, Practical Guide to Solar Energy (2012), pp. 41–42.
- Stickler, Greg. "Educational Brief - Solar Radiation and the Earth System". National Aeronautics and Space Administration. Archived from the original on 25 April 2016. Retrieved 5 May 2016.
- C.Michael Hogan. 2010. Abiotic factor. Encyclopedia of Earth. eds Emily Monosson and C. Cleveland. National Council for Science and the Environment. Washington, DC
- World Bank (2017). Global Solar Atlas.
- Kirk, Alexander P. (2015). Solar Photovoltaic Cells Photons to Electricity. . pp. 9–24. .
- Zhang, T., Stackhouse Jr., P.W., Macpherson, B., and Mikovitz, J.C., 2024. A CERES-based dataset of hourly DNI, DHI and global tilted irradiance (GTI) on equatorward tilted surfaces: Derivation and comparison with the ground-based BSRN data. Sol. Energy, 274 (2024) 112538. doi: https://doi.org/10.1016/j.solener.2024.112538.
- "Solar Resource Glossary". National Renewable Energy Laboratory. Retrieved 10 February 2025.
- "What is the Difference between Horizontal and Tilted Global Solar Irradiance?". Kipp & Zonen. Retrieved 25 November 2017.
- Gueymard, Christian A. (March 2009). "Direct and indirect uncertainties in the prediction of tilted irradiance for solar engineering applications". Solar Energy. 83 (3): 432–444. :2009SoEn...83..432G. :10.1016/j.solener.2008.11.004.
📸 フォトギャラリー