The Sun, as seen from low Earth orbit overlooking the International Space Station. This sunlight is not filtered by the lower atmosphere, which blocks much of the solar spectrum.
← ホームへ戻る

太陽光の科学地球を育むエネルギーの正体と特性

🗓 2026年8月10日

私たちが日々浴びている太陽光は、単なる「明るさ」ではなく、太陽から放出される電磁波の一種です。このエネルギーは地球上のあらゆる生命活動の根源となっており、植物の成長から人間の健康、そして地球全体の気候システムに至るまで、決定的な役割を果たしています。

太陽光が地球に届くまでの旅は驚くべきものです。太陽の表面から地球まで到達するのにかかる時間は約8.3分ですが、光の粒子である光子が太陽の中心部から表面まで辿り着くには、電荷を持つ粒子に衝突して方向を変えながら、1万年から17万年もの時間を要すると考えられています。
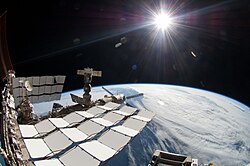
The Sun, as seen from low Earth orbit overlooking the International Space Station. This sunlight is not filtered by the lower atmosphere, which blocks much of the solar spectrum.

Key Facts

  • 成分: 主に赤外線(約52〜55%)、可視光線(約42〜43%)、紫外線(約3〜5%)で構成されている。
  • 到達時間: 太陽表面から地球まで約8.3分で到達する。
  • エネルギー量: 地球大気圏外での日射強度は約1,367 W/m²(1天文単位時)。
  • 生物への影響: 光合成のエネルギー源となる一方、紫外線はビタミンD3合成を助けるが、過剰であれば変異原として作用する。

太陽光の組成とスペクトルの正体

太陽光は、人間の目で捉えられる「可視光線」だけでなく、目に見えない「赤外線」や「紫外線」を含んでいます。アメリカ気象学会などの定義では、これらすべてを「光」と呼ぶか、あるいは可視光線のみを指すかについて議論がありますが、科学的には広範な電磁波スペクトルとして捉えられます。
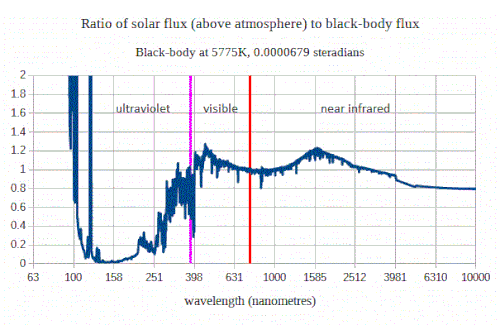
Solar spectrum compared to black-body at 5775 K

エネルギーの分布を見ると、大気圏外では紫外線が約8%含まれていますが、その多くは生物に有害な短波長成分です。大気を通過して地表に届く頃には、フィルターのように成分が変化し、赤外線が過半数を占めるようになります。
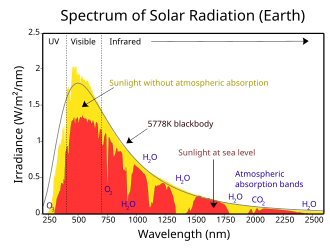
Solar spectral irradiance (watts per square metre per nanometre) above atmosphere (yellow) and at surface (red). Extreme UV and X-rays are produced (left of wavelength range) but comprise very small amounts of the Sun's total output power (area under the curve).

波長による分類

太陽放射の大部分(約98.7%)は200nmから4000nmの範囲に収まっており、主に以下の領域に分けられます。

  • 紫外線 400nm未満。生理的影響(日焼けなど)を及ぼす。
  • 可視光線 400nmから700nm。人間が視覚的に認識できる領域。
  • 赤外線: 700nmから1,000,000nm(1mm)。熱として感知され、さらにA(近赤外線)、B(中赤外線)、C(遠赤外線)に細分化されます。
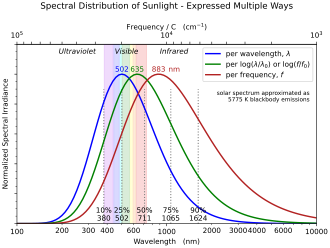
Spectral distribution of sunlight. The different curves reflect 3 different equally valid ways of characterizing the same sunlight. These curves have peaks at different wavelengths, which demonstrates that the notion of a location where the "peak" amount of sunlight is emitted is not meaningful, and is not a characteristic of the light itself (but is merely an artifact of how the spectrum is represented). Percentiles offer a way of thinking about the distribution of energy which is independent of the representation. 50 percent of solar irradiance is associated with wavelengths less than about 711 nm (based on approximating sunlight by the emissions of a 5775 K blackbody).

よく「太陽の最大出力は可視光領域にある」と言われますが、これは表現方法による誤解です。波長ベースでグラフ化すると約501nm(可視光)にピークが出ますが、周波数ベースで計算すると約882nm(近赤外線)にピークが移動します。つまり、特定の波長だけが突出して強いという考え方よりも、エネルギー分布として捉えるのが適切です。
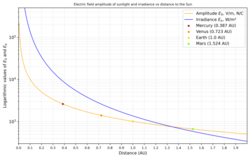
A plot showing amplitude of electric field of sunlight and irradiance based on distance to the Sun. Electric field amplitude at 1 astronomical unit (149.6 million kilometres) is about 1013 V/m.

地球への到達と環境による変化

太陽光が地表に届く際、大気による散乱や吸収が起こります。雲に遮られず直接届くものは「日照(sunshine)」として感じられ、明るい光と放射熱を同時にもたらします。一方で、雲や物体に反射・散乱した光は「拡散光」となり、柔らかい光として広がります。
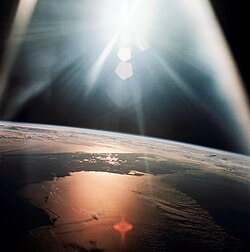
Sunrise over the Gulf of Mexico and Florida. Taken on 20 October 1968 from Apollo 7.

地表でのエネルギー量は、太陽との距離(季節変動)によって変化します。1月は平均より約3.3%高く、7月は約3.3%低くなります。太陽が天頂にあるとき、地表に届く直接光は約1,050 W/m²ですが、大気による間接光を含めた総量は約1,120 W/m²に達します。
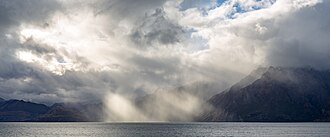
Sunlight shining through clouds, giving rise to crepuscular rays.

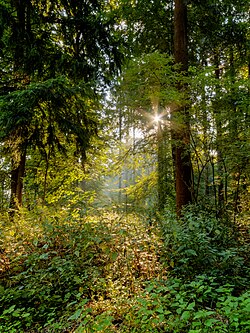
また、森林のキャノピー(樹冠)を透過する光や、雲量によるスペクトルの変化など、環境によって地表に届く光の質は大きく異なります。
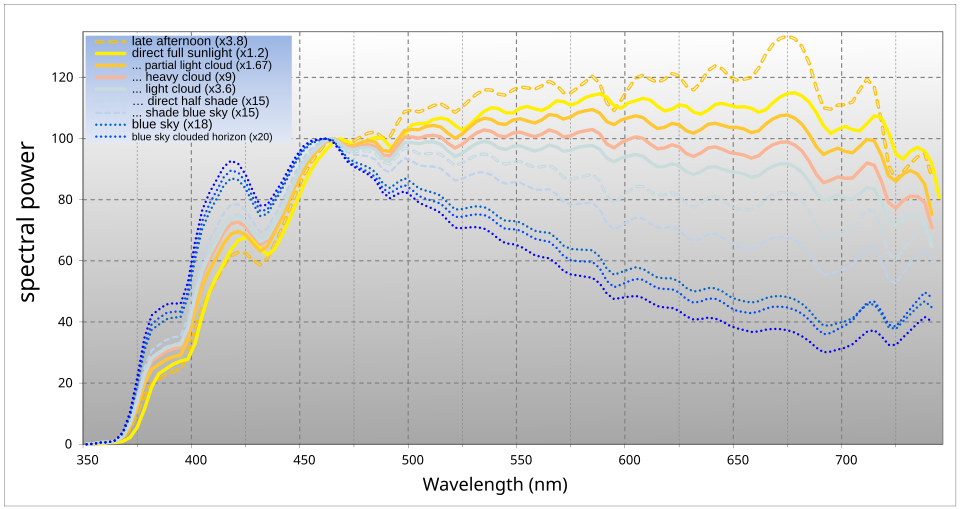
Spectrum of the visible wavelengths at approximately sea level; illumination by direct sunlight compared with direct sunlight scattered by cloud cover and with indirect sunlight by varying degrees of cloud cover. The yellow line shows the power spectrum of direct sunlight under optimal conditions. To aid comparison, the other illumination conditions are scaled by the factor shown in the key so they match at about 470 nm (blue light).

Sunlight penetrating through a forest canopy in Germany.

太陽系における日射強度の比較

太陽からの距離が離れるほど、受け取るエネルギー量は劇的に減少します。地球では十分な光がある一方で、火星では地球よりも暗く、土星に到達する頃には、地球での平均的な日の出・日の入り程度の明るさまで低下します。
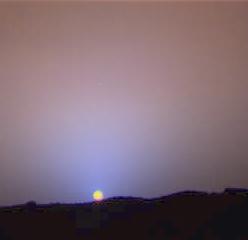
Sunlight on Mars is dimmer than on Earth. This photo of a Martian sunset was imaged by Mars Pathfinder.

さらに遠い冥王星であっても、平均的なリビングルーム程度の明るさは確保されています。地球の満月の光と同等の暗さになるには、太陽から約500天文単位(約69光時)まで離れる必要があります。
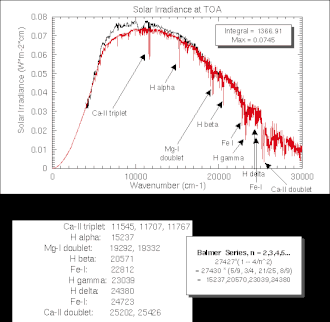
Solar irradiance spectrum at top of atmosphere, on a linear scale and plotted against wavenumber.

太陽系主要天体における日射強度
天体名 平均距離 (AU) 最大日射量 (W/m²) 最小日射量 (W/m²)
水星 0.31 〜 0.47 14,446 6,272
金星 0.72 2,647 2,576
地球 0.98 〜 1.02 1,413 1,321
火星 1.38 〜 1.67 715 492
木星 4.95 〜 5.46 55.8 45.9
土星 9.05 〜 10.12 16.7 13.4
天王星 18.38 〜 20.08 4.04 3.39
海王星 29.77 〜 30.44 1.54 1.47
冥王星 29.66 〜 48.87 1.55 0.57

文化と生活への影響

太陽光は科学的なエネルギー源であるだけでなく、人類の文化や芸術、健康習慣にも深く根ざしています。絵画における光の表現は、時代とともに進化し、自然光の捉え方が作品の印象を決定づけてきました。
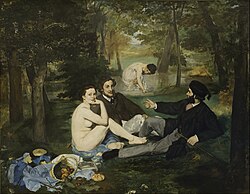
Édouard Manet: Le déjeuner sur l'herbe (1862–63).

Téli verőfény ("Winter Sunshine") by László Mednyánszky, early 20th century.

また、日光浴は健康維持の一環として行われていますが、これは前述のビタミンD3合成などの生理的メリットを享受するためです。しかし、同時に皮膚へのダメージというリスクを伴うため、適切なバランスが重要となります。
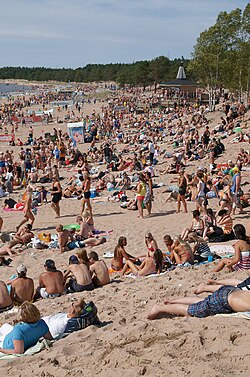
Sun bathers in Finland

Frequently Asked Questions

太陽光が地球に届くまでにどれくらいの時間がかかりますか?

太陽の表面から地球まで届くのにかかる時間は約8.3分です。ただし、光子が太陽の中心から表面まで移動するには、内部の粒子に衝突し続けるため、1万年から17万年という膨大な時間がかかるとされています。

太陽光のエネルギーの中で最も割合が多いのは何ですか?

地表に届く太陽光のエネルギー組成では、赤外線が約52〜55%と最も多く、次いで可視光線が約42〜43%、紫外線が約3〜5%となっています。

太陽光の「ピーク波長」はどこにありますか?

計算方法によって異なります。波長ベースで見た場合は約501nm(可視光領域)にピークがありますが、周波数ベースで見た場合は約882nm(近赤外線領域)になります。そのため、単一の「ピーク」を定義することにはあまり意味がなく、分布として理解することが重要です。

紫外線にはどのようなメリットとデメリットがありますか?

メリットとしては、人体におけるビタミンD3の合成に不可欠である点が挙げられます。一方でデメリットとしては、皮膚へのダメージ(日焼け)や、遺伝子に影響を与える変異原として作用し、健康リスクを高める可能性がある点が挙げられます。

太陽定数は本当に「一定」なのでしょうか?

いいえ、実際には一定ではありません。1978年以降の宇宙観測により、11年周期の太陽黒点サイクルなど、さまざまな時間スケールで日射強度が変動していることが明らかになっています。

References

  1. "Sunlight". Glossary of Meteorology. American Meteorological Society. Retrieved 2025-03-23.
  2. "Climate and Earth's Energy Budget". earthobservatory.nasa.gov. 14 January 2009. Retrieved 2022-01-27.
  3. "Basics of Solar Energy". Archived from the original on 2016-11-28. Retrieved 2016-12-06.
  4. Bell Burnell, S. Jocelyn (2004). An Introduction to the Sun and Stars (illustrated ed.). Cambridge University Press. p. 56.  . Extract of page 56
  5. "The 8-minute travel time to Earth by sunlight hides a thousand-year journey that actually began in the core". SunEarthDay.NASA.gov. . Archived from the original on 2012-01-22. Retrieved 2012-02-12.
  6. C. KANDILLI & K. ULGEN. "Solar Illumination and Estimating Daylight Availability of Global Solar Irradiance". Energy Sources.
  7. "Introduction to Solar Radiation". Newport Corporation. Archived from the original on October 29, 2013.
  8. Calculated from data in "Reference Solar Spectral Irradiance: Air Mass 1.5". National Renewable Energy Laboratory. Archived from the original on September 28, 2013. Retrieved 2009-11-12.
    The first of each set of two figures is for total solar radiation reaching a panel aimed at the Sun (which is 42° above the horizon), whereas the second figure of each pair is the "direct plus circumsolar" radiation (circumsolar meaning coming from the part of the sky within a couple degrees of the Sun). The totals, from 280 to 4000 nm, are 1000.4 and 900.1 W/m2 respectively. It would be good to have more direct figures from a good source, rather than summing thousands of numbers in a database.
  9. Calculated from the ASTM spectrum cited above.
  10. Qiang, Fu (2003). "Radiation (Solar)" (PDF). In Holton, James R. (ed.). Encyclopedia of atmospheric sciences. Vol. 5. Amsterdam: Academic Press. pp. 1859–1863.  .  249246073. Archived (PDF) from the original on 2012-11-01.

📸 フォトギャラリー

The Sun, as seen from low Earth orbit overlooking the International Space Station. This sunlight is not filtered by the lower atmosphere, which blocks much of the solar spectrum.
Sunrise over the Gulf of Mexico and Florida. Taken on 20 October 1968 from Apollo 7.
A plot showing amplitude of electric field of sunlight and irradiance based on distance to the Sun. Electric field amplitude at 1 astronomical unit (149.6 million kilometres) is about 1013 V/m.
Solar spectrum compared to black-body at 5775 K
Solar spectral irradiance (watts per square metre per nanometre) above atmosphere (yellow) and at surface (red). Extreme UV and X-rays are produced (left of wavelength range) but comprise very small amounts of the Sun's total output power (area under the curve).
Spectral distribution of sunlight. The different curves reflect 3 different equally valid ways of characterizing the same sunlight. These curves have peaks at different wavelengths, which demonstrates that the notion of a location where the "peak" amount of sunlight is emitted is not meaningful, and is not a characteristic of the light itself (but is merely an artifact of how the spectrum is represented). Percentiles offer a way of thinking about the distribution of energy which is independent of the representation. 50 percent of solar irradiance is associated with wavelengths less than about 711 nm (based on approximating sunlight by the emissions of a 5775 K blackbody).
Sunlight on Mars is dimmer than on Earth. This photo of a Martian sunset was imaged by Mars Pathfinder.
Solar irradiance spectrum at top of atmosphere, on a linear scale and plotted against wavenumber.
Sunlight shining through clouds, giving rise to crepuscular rays.
Spectrum of the visible wavelengths at approximately sea level; illumination by direct sunlight compared with direct sunlight scattered by cloud cover and with indirect sunlight by varying degrees of cloud cover. The yellow line shows the power spectrum of direct sunlight under optimal conditions. To aid comparison, the other illumination conditions are scaled by the factor shown in the key so they match at about 470 nm (blue light).
Sunlight penetrating through a forest canopy in Germany.
Édouard Manet: Le déjeuner sur l'herbe (1862–63).
Téli verőfény ("Winter Sunshine") by László Mednyánszky, early 20th century.
Sun bathers in Finland