複雑なネットワーク(生物学的回路や社会的なつながりなど)を分析する際、全体的な構造だけでなく、頻繁に現れる小さなパターンに注目することが重要です。このような特定のパターンをネットワークモチーフと呼びます。これらは、ネットワーク全体が果たす機能の最小単位となる「ビルディングブロック」のような役割を果たしており、その出現頻度を解析することで、システムの設計原理や進化の過程を明らかにすることができます。
Key Facts
- 定義: ネットワークモチーフとは、ランダムなネットワークと比較して統計的に有意に多く出現するサブグラフ(部分グラフ)のことである。
- 機能的役割: 生物学的ネットワークにおいて、応答時間の短縮や信号の遅延、安定性の確保などの重要な制御機能を担う。
- 検出手法: ネットワーク全体から特定のパターンを数え上げる「ネットワーク中心型」と、特定のパターンを探索する「サブグラフ中心型」のアルゴリズムが存在する。
- 代表例: 自己制御(オートレギュレーション)やフィードフォワードループ(FFL)などがよく知られている。
ネットワークモチーフの概念と頻度の定義
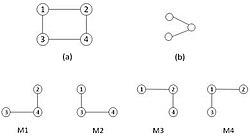
ネットワークモチーフを特定するには、まずターゲットとなるサブグラフが元のグラフの中でどれだけ出現するかを正確にカウントする必要があります。しかし、「出現」の定義にはいくつかの考え方(頻度概念)があります。例えば、完全に一致する箇所をすべて数える方法もあれば、要素の重複を制限して数える方法もあります。これにより、ネットワーク要素の利用制限が厳しくなるほど、算出される頻度は低下します。
グラフの同型性と対称性の排除
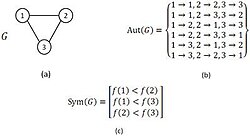
アルゴリズムが効率的に動作するためには、構造的に同じ(同型な)サブグラフを重複して数えない工夫が必要です。対称性の破壊(Symmetry-breaking)という手法を用いることで、同型なマッピングを排除し、各サブグラフを一度だけ列挙することが可能になります。
モチーフ検出アルゴリズムの分類と特徴
モチーフを検出するためのアプローチは、大きく分けて2つの戦略に分類されます。一つはネットワーク全体を走査してすべてのサブグラフを抽出する手法、もう一つは特定のクエリグラフ(探したい形)をベースに探索する手法です。
主要なアルゴリズムの比較
代表的なツールとして、ESUアルゴリズムを採用したFANMODや、パターンツリーを利用するFPF (Mavisto)、効率的な列挙を行うKavoshやMODAなどが挙げられます。また、計算コストを抑えるためにカラーコーディング法を用いた近似的なアプローチも研究されています。
![Illustration of the pattern tree in FPF algorithm.[12]](/images/d4/c9/d4c97348a02f699f86113f6b602cb7808039344cf3e695c6cf41cd694e9c0386.jpg)
クエリグラフを拡張して探索する場合、ノード数を増やしながらエッジを追加していく拡張ツリーが構築されます。この過程で、異なるエッジの追加経路が結果的に同じ構造(同型なグラフ)を生成する場合があり、これを適切に処理することが計算効率の鍵となります。
![Illustration of the expansion tree T4 for 4-node query graphs. At the first level, there are non-isomorphic k-size trees and at each level, an edge is added to the parent graph to form a child graph. In the second level, there is a graph with two alternative edges that is shown by a dashed red edge. In fact, this node represents two expanded graphs that are isomorphic.[35]](/images/c7/4a/c74a36d1e0818d58098920daf72355c6dba571bfc92a55c181585869416e2c7c.jpg)
パフォーマンスの傾向
アルゴリズムの実行時間は、探索するサブグラフのサイズ(ノード数)が増えるにつれて指数関数的に増加します。特にノード数が8〜9を超えると、計算負荷が極めて高くなる傾向にあります。
![Runtimes of Grochow–Kellis, mfinder, FANMOD, FPF and MODA for subgraphs from three nodes up to nine nodes.[35]](/images/ad/18/ad180d3934c1c50246fcee00b82640375f1c4bb40fe64f95a7f3ec7c56231013.jpg)
代表的なモチーフとその機能
特に生物学的な制御ネットワークにおいて、機能的に重要な役割を果たすモチーフがいくつか特定されています。
自己制御モチーフ(Auto-regulation)
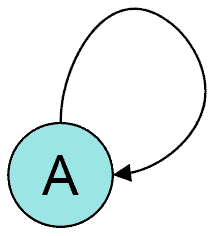
あるノードが自分自身に影響を与える構造です。負の自己制御(NAR)は応答時間を早め、システムの安定性を高める効果があります。一方で、正の自己制御(PAR)はバイナリ的な応答(ON/OFFの切り替え)を可能にし、細胞分化などの不可逆的なプロセスに関与します。
フィードフォワードループ(FFL)
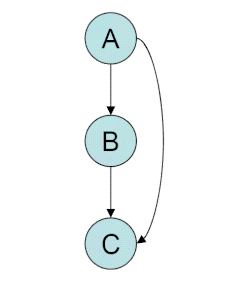
3つのノードで構成され、一つのノードが別のノードを介して、および直接的に第三のノードを制御する構造です。コヒーレント型(C1-FFL)は信号の遅延要素として機能し、一時的なノイズを排除して持続的な信号のみを伝達します。対してインコヒーレント型(I1-FFL)は応答を加速させたり、パルス状の出力を生成したりする特性を持ちます。
アルゴリズムの概要まとめ
| アルゴリズム名 | アプローチ | 方向性 | 誘導サブグラフ | 特徴 |
|---|---|---|---|---|
| mfinder | ネットワーク中心 | 両対応 | 対応 | 汎用的な計数手法 |
| FANMOD (ESU) | ネットワーク中心 | 両対応 | 対応 | 高速な列挙が可能 |
| Mavisto (FPF) | サブグラフ中心 | 両対応 | 対応 | パターンツリーを利用 |
| MODA | サブグラフ中心 | 両対応 | - | 効率的な生物ネットワーク解析 |
| Kavosh | ネットワーク中心 | 両対応 | 対応 | 整数の組成を利用した抽出 |
Frequently Asked Questions
ネットワークモチーフと単なるサブグラフの違いは何ですか?
単なるサブグラフはグラフ内に存在するあらゆる部分構造を指しますが、ネットワークモチーフは、ランダムに生成された同等のネットワークと比較して、統計的に有意に高い頻度で出現するサブグラフのことを指します。
なぜ誘導サブグラフ(Induced Subgraph)が重要なのですか?
誘導サブグラフとは、選択したノード間に存在するすべてのエッジを含める形式のことです。これにより、構造の完全な一致を判定でき、ネットワーク内の正確なパターン分析が可能になります。
生物学的ネットワークでモチーフを解析するメリットは何ですか?
複雑な遺伝子制御ネットワークなどを小さな機能単位(モチーフ)に分解して理解することで、システムがどのように信号を処理し、外部刺激に反応しているかという動的なメカニズムを解明できるためです。
計算時間が非常に長い場合、どのような対策がありますか?
探索するノード数を制限する、サンプリング手法を用いて近似値を算出する、あるいはカラーコーディング法のような計算量を削減できる特殊なアルゴリズムを採用することが有効です。
References
- Masoudi-Nejad A, Schreiber F, Razaghi MK Z (2012). "Building Blocks of Biological Networks: A Review on Major Network Motif Discovery Algorithms". IET Systems Biology. 6 (5): 164–74. :10.1049/iet-syb.2011.0011. 23101871.
- Diestel, Reinhard (2005). Graph theory (3rd ed.). Berlin: Springer. .
- Milo R, Shen-Orr SS, Itzkovitz S, Kashtan N, Chklovskii D, Alon U (2002). "Network motifs: simple building blocks of complex networks". Science. 298 (5594): 824–827. :2002Sci...298..824M. 10.1.1.225.8750. :10.1126/science.298.5594.824. 12399590. 9884096.
{{}}: Cite uses deprecated parameter|citeseerx=() - Albert R, Barabási AL (2002). "Statistical mechanics of complex networks". Reviews of Modern Physics. 74 (1): 47–49. :cond-mat/0106096. :2002RvMP...74...47A. 10.1.1.242.4753. :10.1103/RevModPhys.74.47. 60545.
{{}}: Cite uses deprecated parameter|citeseerx=() - Milo R, Itzkovitz S, Kashtan N, Levitt R, Shen-Orr S, Ayzenshtat I, Sheffer M, Alon U (2004). "Superfamilies of designed and evolved networks". Science. 303 (5663): 1538–1542. :2004Sci...303.1538M. :10.1126/science.1089167. 15001784. 14760882.
- Schwöbbermeyer, H (2008). "Network Motifs". In Junker BH, Schreiber F (ed.). Analysis of Biological Networks. Hoboken, New Jersey: John Wiley & Sons. pp. 85–108.
- Bornholdt, S; Schuster, HG, eds. (2003). Handbook of graphs and networks: from the genome to the Internet. p. 417. :2003hgnf.book.....B.
- Ciriello G, Guerra C (2008). "A review on models and algorithms for motif discovery in protein-protein interaction networks". Briefings in Functional Genomics and Proteomics. 7 (2): 147–156. :10.1093/bfgp/eln015. 18443014.
- Kashtan N, Itzkovitz S, Milo R, Alon U (2004). "Efficient sampling algorithm for estimating sub-graph concentrations and detecting network motifs". Bioinformatics. 20 (11): 1746–1758. :10.1093/bioinformatics/bth163. 15001476.
- Wernicke S (2006). "Efficient detection of network motifs". IEEE/ACM Transactions on Computational Biology and Bioinformatics. 3 (4): 347–359. :2006ITCBB...3..347W. 10.1.1.304.2576. :10.1109/tcbb.2006.51. 17085844. 6188339.
{{}}: Cite uses deprecated parameter|citeseerx=()
📸 フォトギャラリー