私たちの身の回りにあるSNSの人間関係、インターネットの通信経路、あるいは都市の道路網など、複雑に絡み合う「つながり」を数学的に分析する手法がグラフ理論です。これは離散数学の一分野であり、物体同士のペア関係をモデル化することで、効率的なルート探索や構造の対称性などを明らかにします。
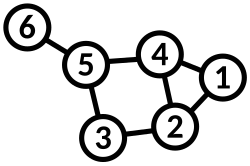
グラフ理論における「グラフ」とは、日常的に使う統計グラフのことではなく、頂点(ノード)と呼ばれる点と、それらを結ぶエッジ(辺)からなる数学的構造を指します。エッジに方向がないものを「無向グラフ」、矢印のように方向を持つものを「有向グラフ」と呼び分けます。
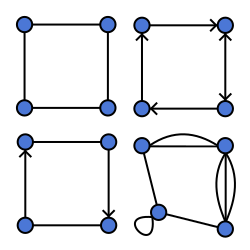
Key Facts
- 基本構成: 頂点(点)とエッジ(線)で構成され、要素間の関係性を可視化・分析する。
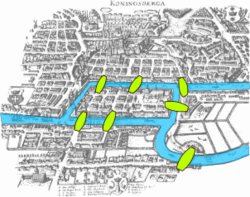
- 起源: 1736年にレオンハルト・オイラーが提示した「ケーニヒスベルクの橋」の問題が始まりとされる。
- 広範な応用: コンピュータサイエンス、化学、社会学、生物学など、多岐にわたる分野で利用されている。
- 重要課題: 「四色問題」のような地図の塗り分け問題や、最短経路問題などが代表的な研究テーマである。
グラフ理論の歴史と発展
オイラーからトポロジーへ
グラフ理論の幕開けは、18世紀の数学者レオンハルト・オイラーによる挑戦でした。彼は、ケーニヒスベルクにある7つの橋をすべて一度だけ渡って元の場所に戻れるかという問いに対し、橋の具体的な長さや形ではなく、「どの地点がどの橋で結ばれているか」という接続関係のみに注目して解答を導き出しました。このアプローチは、後のトポロジー(位相幾何学)の基礎となりました。
化学と数学の融合
19世紀後半になると、アーサー・ケイリーが化学物質の構造を分析するために「木(ツリー)」と呼ばれる特殊なグラフ構造を研究しました。これにより、数学的な列挙手法が化学組成の解明に寄与し、理論化学の発展を後押ししました。その後、ポリアやデ・ブルインらによって、特定の性質を持つグラフを数え上げる「列挙グラフ理論」へと進化しました。
計算機時代の到来と四色問題
グラフ理論における最も有名な難問の一つが「四色問題」です。これは、平面上のどのような地図でも、隣接する領域を異なる色で塗り分けるには最大4色あれば十分かという問いです。1852年に提示されて以来、多くの数学者が挑みましたが、1976年にケネス・アペルとヴォルフガング・ハーケンがコンピュータを用いて膨大なケースを検証し、ついに証明に成功しました。
専門的な研究領域
現代のグラフ理論は、目的や手法に応じて以下のような高度なサブエリアに分かれています。
代数的・幾何学的アプローチ
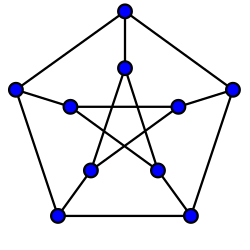
代数グラフ理論では、群論などの代数的な手法を用いてグラフの対称性を研究します。例えば、ペテルセングラフのような高度な対称性を持つ構造の解析に用いられます。また、幾何グラフ理論では、ユークリッド空間上の点や多面体グラフ、円充填などの幾何学的性質を扱います。
極値グラフ理論とランダムグラフ
極値グラフ理論は、ある条件を満たすグラフが持ちうるエッジの最大数(極値数)を追求します。マンテルの方程式などがその代表例です。一方、ランダムグラフ理論では、エッジが確率的に生成されるモデルを扱い、複雑なネットワークの挙動を統計的に分析します。
実社会への応用例
グラフ理論は、単なる数学的パズルではなく、現代社会のインフラを支える不可欠なツールとなっています。
- コンピュータサイエンス: ネットワークルーティング、データ構造の最適化、アルゴリズム設計。
- 社会科学: 人間関係の可視化(ソシオグラム)や、SNSにおける影響力の分析。
- 生物学・化学: タンパク質の相互作用ネットワークや、分子構造の解析。
- 物流・交通: 巡回セールスマン問題や最短経路の算出による配送効率化。
![The network graph formed by Wikipedia editors (edges) contributing to different Wikipedia language versions (vertices) during one month in summer 2013[58]](/images/8b/29/8b29d2ac9c2e2dbaebaa227863e1bb4a2377270e7ceb17cb2c85530202d1fae8.webp)
![Graph theory in sociology: Moreno Sociogram (1953).[68]](/images/6e/bc/6ebc72dfdb0643ee8084c0394ef919c8168c3e02a8b52f476e26f25dff05669f.webp)
グラフ理論の概要まとめ
| 項目 | 内容 | 具体例・応用 |
|---|---|---|
| 基本要素 | 頂点(Vertex)とエッジ(Edge) | 駅(頂点)と路線(エッジ) |
| 主要な種類 | 無向グラフ、有向グラフ、混合グラフ | 双方向道路、一方通行道路 |
| 代表的な問題 | 最短経路問題、四色問題、ハミルトン路 | カーナビのルート検索、地図の塗り分け |
| 応用分野 | 情報工学、化学、社会学、生物学 | Webページ間のリンク解析、分子構造式 |
Frequently Asked Questions
グラフ理論でいう「グラフ」とは何ですか?
統計学で使われる棒グラフや折れ線グラフとは異なり、点(頂点)とそれを結ぶ線(エッジ)で構成されるネットワーク状の数学的構造を指します。
「四色問題」がなぜ重要だったのですか?
単純な問いに見えながら、証明に100年以上かかり、最終的にコンピュータによる証明が必要となったため、数学における証明のあり方や計算機科学の可能性を示す象徴的な問題となりました。
有向グラフと無向グラフの違いは何ですか?
無向グラフはエッジに方向がなく、双方向の対称的な関係(例:友人関係)を表します。有向グラフはエッジに方向があり、非対称な関係(例:Twitterのフォロー関係)を表します。
日常生活のどのような場面でグラフ理論が使われていますか?
Googleの検索エンジンがページランクを計算する仕組みや、カーナビの最短ルート検索、SNSの「おすすめユーザー」の提案など、多くのデジタルサービスに組み込まれています。
グラフ理論を学ぶことでどのようなメリットがありますか?
複雑な事象を単純な構造にモデル化して考える能力が身につき、効率的な問題解決策(アルゴリズム)を導き出す論理的思考力が養われます。
References
📸 フォトギャラリー