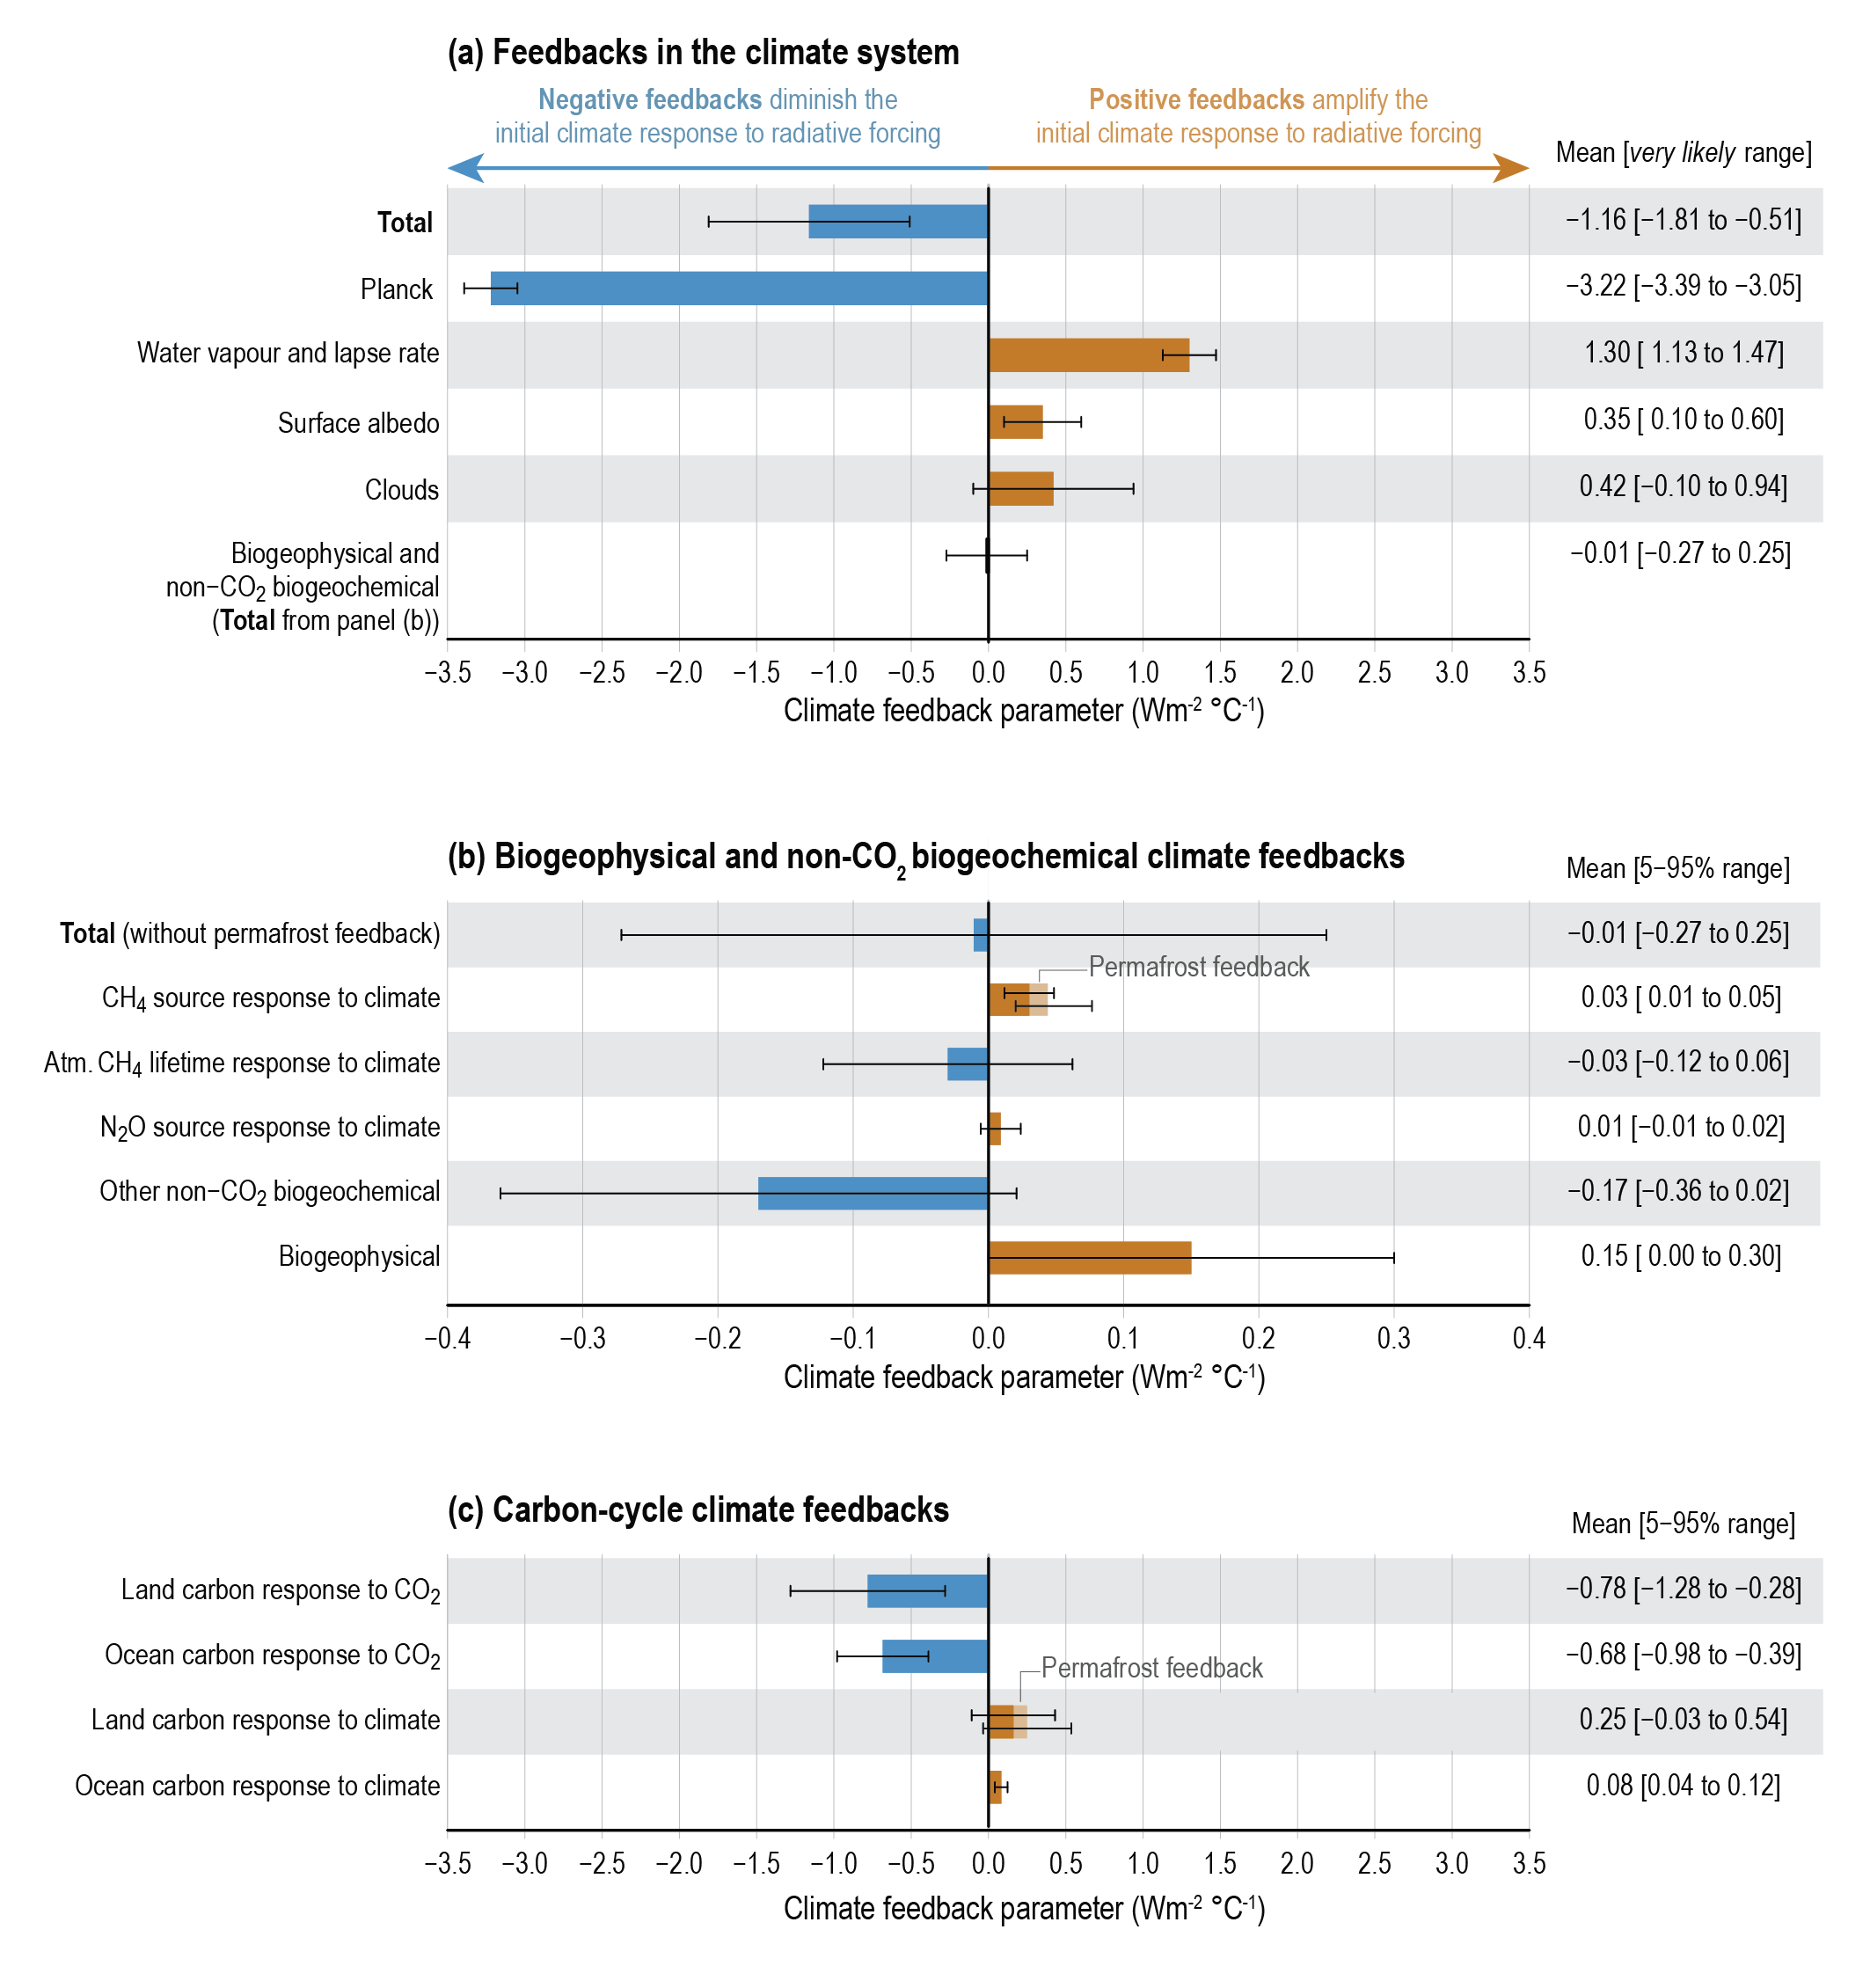
地球の気温が上昇する際、単に温室効果ガスの量だけで温度が決まるわけではありません。自然界には、一度始まった温度変化をさらに加速させる正のフィードバックと、逆に変化を抑制して安定させようとする負のフィードバックという2つの仕組みが存在します。これらの相互作用が、最終的に地球がどれだけ温暖化するかという「気候感度」を決定づけています。
現在、地球全体のフィードバックの総和は負の状態にありますが、温室効果ガスの排出が続くことで、その抑制効果は徐々に弱まっています。つまり、温暖化のスピードは抑制されているものの、排出が止まらなければ加速するリスクを孕んでいるということです。ただし、地球が温まるほど宇宙へ放出される熱放射が増えるため、人間活動のみで制御不能な「暴走温室効果」が起きることはないと考えられています。
![The relative magnitude of the top 6 climate change feedbacks and what they influence. Positive feedbacks amplify the global warming response to greenhouse gas emissions and negative feedbacks reduce it.[1] In this chart, the horizontal lengths of the red and blue bars indicate the strength of respective feedbacks.](/images/5f/11/5f114a80b927c90d123c232765f8666f6b17bb08735ac3b190c0efbe4970475f.webp)
Key Facts
- 正のフィードバックは温暖化を増幅させ、負のフィードバックはそれを抑制する。
- 水蒸気の増加は、CO2による温暖化効果を実質的に倍増させる強力な正のフィードバックである。
- 氷床や海氷の減少による反射率(アルベド)の低下が、さらなる熱吸収を招く。
- プランク応答(温度上昇に伴う放射エネルギーの増加)が、地球の温度を安定させる最大の負のフィードバックとして機能している。
- 炭素サイクルによる吸収能力は、温度上昇や飽和によって長期的には低下する可能性がある。
物理的フィードバックの仕組み
熱放射による安定化(プランク応答)
地球が温暖化すると、物体が温度上昇に伴いより多くの赤外線を放出するという物理法則(プランク応答)により、宇宙へ逃げる熱量が増加します。これは気候システムにおける最も強力な負のフィードバックであり、地球が無限に温度上昇することを防ぐブレーキの役割を果たしています。
![Climate change occurs because the amount of thermal radiation absorbed by different parts of the Earth's environment currently exceeds the amount radiated away to space.[16] As the warming increases, outgoing radiation to space increases quickly due to the Planck response, which eventually helps to stabilize the Earth at some higher temperature level[17]](/images/96/e6/96e62dadaae6d27f1c844113085ff15b9616aed285c8c733808993614111eff3.png)
水蒸気と雲の影響
水蒸気は非常に強力な温室効果ガスです。気温が上がると大気中の水蒸気量が増え、それがさらに熱を蓄えるため、温暖化が加速する正のフィードバックループが形成されます。衛星観測などのデータによれば、この効果はCO2単独の場合の温暖化幅をほぼ2倍にまで押し上げるとされています。
![Atmospheric gases only absorb some wavelengths of energy but are transparent to others. The absorption patterns of water vapor (blue peaks) and carbon dioxide (pink peaks) overlap in some wavelengths.[21]](/images/b6/3c/b63c8eb4f67b8d2dd360279df6670594b038fc486fc4f43e0c8a28f0740a813b.png)
また、水蒸気の分布は雲の形成に影響を与えます。雲は太陽光を反射して冷却する効果と、地表からの熱を閉じ込めて保温する効果の両面を持っており、高度や種類によって気候への影響が異なります。
![Details of how clouds interact with shortwave and longwave radiation at different atmospheric heights[45]](/images/a6/7b/a67b73c82745750775e8c4ea944cfd42f5e362bad6590c94cdddff6fc9119d2b.png)
気温減率(ラプスレート)
高度が上がるにつれて気温が下がる「気温減率」も重要な要素です。極地方を除く多くの地域で、この仕組みは負のフィードバックとして働き、全体の温暖化を抑制する方向に寄与しています。
![Lapse rate (green) is a negative feedback everywhere on Earth besides the polar latitudes. The net climate feedback (black) becomes less negative if it were excluded (orange)[24]](/images/80/18/80188eb0fc4189c6d9f084d3cc17f866bd38b8274ee22f318b027482130c20bb.jpg)
表面アルベドの低下
アルベドとは地表の太陽光反射率のことです。温暖化で海氷や積雪が減少すると、白い氷(高反射)から暗い海や地面(低反射)へと表面が変わり、より多くの太陽エネルギーが吸収されます。これによりさらに温度が上がり、さらに氷が溶けるという悪循環に陥ります。
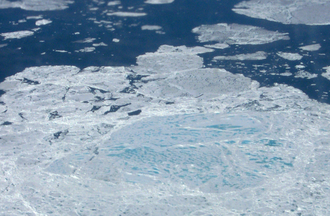
特に北極圏の海氷減少は顕著で、1979年から2011年にかけての海氷減少による放射強制力は、同期間のCO2排出による影響の約4分の1に相当すると推定されています。
![The loss of albedo from major ice areas on Earth adds to warming: the values shown are for the initial warming of 1.5 °C (2.7 °F).[43] Total ice sheet loss requires multiple millennia: the others can be lost in a century or two[58][59]](/images/74/73/7473bd5db35522cd6e1589a66c1445d6a7c474e423cf469a74956b162e9ea663.jpg)
生物学的・化学的フィードバックと炭素サイクル
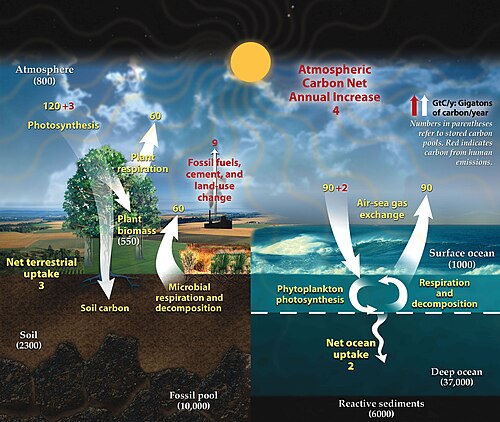
炭素の吸収と放出
地球上の植物や海洋は、人間が排出したCO2の半分以上を毎年吸収しています。光合成による植物の成長(CO2施肥効果)は、短期的には温暖化を抑える負のフィードバックとして機能します。
![Increase in global leaf area between 1982 and 2015, which was primarily caused by the CO2 fertilization effect[65]](/images/ee/a5/eea558855fdcbad629e4bf3e167f9ca686efd33724baa7950590753c435c9f6e.png)
しかし、長期的には吸収源(シンク)が飽和状態になったり、高温による干ばつや森林火災が増えたりすることで、吸収効率が低下し、逆に炭素を放出するリスクが高まります。
![The impulse response following a 100 GtC injection of CO2 into Earth's atmosphere.[60] The majority of excess carbon is removed by ocean and land sinks in less than a few centuries, while a substantial portion persists.](/images/36/48/3648beaa01de644461c5cdf5c955355475212239827c804dcb2fc0ab15c973bb.webp)
永久凍土とメタンの脅威
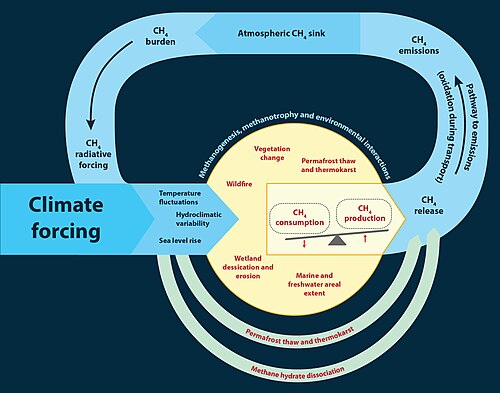
北極圏の永久凍土には膨大な量の有機炭素が蓄積されています。温暖化で凍土が融解すると、微生物による分解が進み、CO2やメタン(CH4)などの強力な温室効果ガスが放出されます。これは温暖化をさらに加速させる正のフィードバックとなります。
![Nine probable scenarios of greenhouse gas emissions from permafrost thaw during the 21st century, which show a limited, moderate and intense CO2 and CH4 emission response to low, medium and high-emission Representative Concentration Pathways. The vertical bar uses emissions of selected large countries as a comparison: the right-hand side of the scale shows their cumulative emissions since the start of the Industrial Revolution, while the left-hand side shows each country's cumulative emissions for the rest of the 21st century if they remained unchanged from their 2019 levels.[72]](/images/1d/03/1d030de201ee1b9a410aa2c7faafbe929bfb2351c3245891635ea78a7d1b4a87.jpg)
長期的な影響と気候感度
氷床の融解は非常に長い時間をかけて進行します。例えば、グリーンランドや西南極の氷床は、地球平均気温が1.5°C上昇した状態で維持されれば、長期的には完全に消失する運命にあると考えられています。一方で、東南極の氷床が完全に失われるには、5〜10°Cという極めて高い温度上昇が必要とされています。
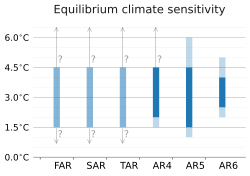
これらの複雑なフィードバックの組み合わせが、気候感度(CO2濃度が2倍になった時にどれだけ気温が上がるか)の不確実性を生んでいます。過去のIPCC報告書でも、この不確実性の主な要因はフィードバックの推定精度にあると指摘されています。
| フィードバック要因 | 種類 | メカニズム | 気候への影響 |
|---|---|---|---|
| プランク応答 | 負 | 温度上昇に伴い宇宙への熱放射が増加 | 温暖化を強力に抑制 |
| 水蒸気 | 正 | 気温上昇で大気中の水蒸気が増加し保温力が向上 | 温暖化を大幅に増幅 |
| 表面アルベド | 正 | 氷・雪の減少で太陽光の吸収量が増加 | 特に極圏の温暖化を加速 |
| 炭素サイクル | 主に負(長期的には正へ) | 植物や海洋によるCO2吸収 | 短期的には抑制、長期的にはリスク |
| 永久凍土 | 正 | 凍土融解によるメタン・CO2の放出 | 温暖化をさらに加速 |
Frequently Asked Questions
正のフィードバックが起きると、地球の温度は無限に上がり続けますか?
いいえ。温度が上がれば上がるほど、プランク応答によって宇宙へ放出される熱エネルギーが急激に増加するため、最終的にはある高い温度レベルで均衡状態に達します。したがって、人間活動だけで暴走温室効果が起きることはないと考えられています。
水蒸気はCO2よりも影響が大きいのでしょうか?
水蒸気は非常に強力な温室効果ガスであり、正のフィードバックとして温暖化を増幅させます。具体的には、CO2による温度上昇によって増えた水蒸気が、さらに温度を押し上げるため、結果としてCO2単独の場合の温暖化幅をほぼ2倍にする効果があります。
アルベドの低下がなぜ問題なのですか?
白い氷や雪は太陽光を鏡のように反射しますが、それが溶けて暗い海や地面になると、太陽光を吸収して熱に変わります。これにより地表温度がさらに上がり、さらに氷が溶けるという悪循環(正のフィードバック)が起きるため、特に北極圏などの温暖化を加速させます。
植物が増えれば、CO2吸収が進んで温暖化は止まりますか?
短期的には、CO2濃度の増加によって植物の成長が促進される「CO2施肥効果」があり、吸収量が増えます。しかし、長期的には土壌や海洋の吸収能力に限界(飽和)が来ることや、温暖化による干ばつや森林火災の増加によって、吸収源が逆に放出源に変わるリスクがあるため、それだけで温暖化を止めることは困難です。
References
- "(a) Feedbacks in the climate system / (b) Carbon-cycle climate feedbacks". IPCC.ch. Intergovernmental Panel on Climate Change. November 2022. Archived from the original on 2 May 2024. AR6 WG1 Technical Summary Fig. TS-17.
- IPCC, 2021: Annex VII: Glossary [Matthews, J.B.R., V. Möller, R. van Diemen, J.S. Fuglestvedt, V. Masson-Delmotte, C. Méndez, S. Semenov, A. Reisinger (eds.)]. In Climate Change 2021: The Physical Science Basis. Contribution of Working Group I to the Sixth Assessment Report of the Intergovernmental Panel on Climate Change [Masson-Delmotte, V., P. Zhai, A. Pirani, S.L. Connors, C. Péan, S. Berger, N. Caud, Y. Chen, L. Goldfarb, M.I. Gomis, M. Huang, K. Leitzell, E. Lonnoy, J.B.R. Matthews, T.K. Maycock, T. Waterfield, O. Yelekçi, R. Yu, and B. Zhou (eds.)]. Cambridge University Press, Cambridge, United Kingdom and New York, NY, USA, pp. 2215–2256, doi:10.1017/9781009157896.022.
- (2021). "Summary for Policymakers" (PDF). The Physical Science Basis. Contribution of Working Group I to the of the Intergovernmental Panel on Climate Change. p. 40. .
- Arias, Paola A.; Bellouin, Nicolas; Coppola, Erika; Jones, Richard G.; Krinner, Gerhard (2021). Technical Summary (PDF). Climate Change 2021: The Physical Science Basis. Contribution of Working Group I to the Sixth Assessment Report of the Intergovernmental Panel on Climate Change (Report). Cambridge University Press, Cambridge, UK and New York, NY, US. pp. 35–144. :10.1017/9781009157896.009. Archived from the original (PDF) on 21 July 2022.
- Kang, Sarah M.; Ceppi, Paulo; Yu, Yue; Kang, In-Sik (24 August 2023). "Recent global climate feedback controlled by Southern Ocean cooling". Nature Geoscience. 16 (9): 775–780. :2023NatGe..16..775K. :10.1038/s41561-023-01256-6. :10044/1/106429.
Net climate feedback is negative as the climate system acts to counteract the forcing; otherwise, the system would be unstable.
- Scoping of the IPCC 5th Assessment Report Cross Cutting Issues (PDF). Thirty-first Session of the IPCC Bali, 26–29 October 2009 (Report). Archived (PDF) from the original on 9 November 2009. Retrieved 24 March 2019.
For instance, a "runaway greenhouse effect"—analogous to Venus--appears to have virtually no chance of being induced by anthropogenic activities.
- Forster, P.; Storelvmo, T.; Armour, K.; Collins, W.; Dufresne, J.-L.; Frame, D.; Lunt, D.J.; Mauritsen, T.; Watanabe, M.; Wild, M.; Zhang, H. (2021). Masson-Delmotte, V.; Zhai, P.; Pirani, A.; Connors, S. L.; Péan, C.; Berger, S.; Caud, N.; Chen, Y.; Goldfarb, L. (eds.). Chapter 7: The Earth's Energy Budget, Climate Feedbacks, and Climate Sensitivity (PDF). Climate Change 2021: The Physical Science Basis. Contribution of Working Group I to the Sixth Assessment Report of the Intergovernmental Panel on Climate Change (Report). Cambridge University Press, Cambridge, UK and New York, NY, US. pp. 923–1054. :10.1017/9781009157896.009.
- Canadell, J.G.; Monteiro, P.M.S.; Costa, M.H.; Cotrim da Cunha, L.; Cox, P. M.; Eliseev, A.V.; Henson, S.; Ishii, M.; Jaccard, S.; Koven, C.; Lohila, A.; Patra, P. K.; Piao, S.; Rogelj, J.; Syampungani, S.; Zaehle, S.; Zickfeld, K. (2021). Masson-Delmotte, V.; Zhai, P.; Pirani, A.; Connors, S. L.; Péan, C.; Berger, S.; Caud, N.; Chen, Y.; Goldfarb, L. (eds.). Chapter 5: Global Carbon and other Biogeochemical Cycles and Feedbacks (PDF). Climate Change 2021: The Physical Science Basis. Contribution of Working Group I to the Sixth Assessment Report of the Intergovernmental Panel on Climate Change (Report). Cambridge University Press, Cambridge, UK and New York, NY, US. pp. 673–816. :10.1017/9781009157896.007.
- Zelinka, M. D.; Myers, T. A.; McCoy, D. T.; Po-Chedley, S.; Caldwell, P. M.; Ceppi, P.; Klein, S. A.; Taylor, K. E. (2020). "Causes of Higher Climate Sensitivity in CMIP6 Models". Geophysical Research Letters. 47 (1) e2019GL085782. :2020GeoRL..4785782Z. :10.1029/2019GL085782. :10044/1/76038. 1944-8007.
- "Increased warming in latest generation of climate models likely caused by clouds: New representations of clouds are making models more sensitive to carbon dioxide". Science Daily. 24 June 2020. Archived from the original on 26 June 2020. Retrieved 26 June 2020.

📸 フォトギャラリー