地球を包み込む大気の温度は、太陽からの放射エネルギー、湿度、そして高度といった多様な要因によって決定されます。私たちが日々体感する気温から、宇宙空間に近い高層大気の極端な温度まで、大気温度は場所と高さによって劇的に変化します。気象学では、特定の地域の年平均気温をMAAT(Mean Annual Air Temperature)と呼び、気候特性を分析する重要な指標としています。
Key Facts
- 地球全体の平均地表温度は約14°Cである。
- 大気は高度に応じて対流圏、成層圏、中間圏、熱圏の4つの層に分かれている。
- 対流圏では、高度が1km上がるごとに平均して6.5°C温度が低下する。
- 地表付近の気温測定は、世界気象機関(WMO)の基準に基づき、地上1.25〜2mの通気性の良い白い遮蔽箱(スティーブンソン・スクリーン)内で行われる。
- 夜間の最低気温は、地表ではなく地上数十センチ上の「ラムダス層」で観測されることがある。
高度による大気構造の変化
大気は高度によって温度変化のパターンが異なるため、大きく4つの層に分類されます。この温度勾配が、それぞれの層の物理的特性を決定づけています。
1. 対流圏(Troposphere)
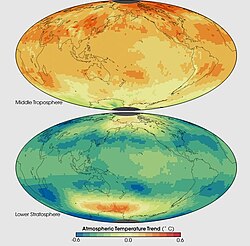
地表から約11km(熱帯地方では約16km、極地方では約8km)までを指します。ここでは高度が上がるにつれて温度が低下するため、地表付近の暖かい空気が上昇し、激しい対流が発生します。この対流と水蒸気の存在が、雨や風などの「気象現象」を引き起こす主因となります。
2. 成層圏(Stratosphere)
対流圏の境界である対流圏界面から高度約50kmまで広がっています。高度20km付近までは温度が一定ですが、それ以上の高さでは逆に温度が上昇する「逆転層」となります。これはオゾン層が太陽からの紫外線を吸収して加熱されるためで、対流が起きにくく安定した層であることが特徴です。
3. 中間圏(Mesosphere)
成層圏界面から高度約85kmまでを指します。ここでは再び高度とともに温度が低下し、地球の大気圏の中で最も低い温度が記録されます。これは、熱圏で吸収された後の少ない太陽放射しか届かないためです。
4. 熱圏(Thermosphere)
中間圏界面から大気の最外縁までを指します。ヴァン・アレン帯などの強力な電離放射の影響を受けるため、非常に高い温度に達します。
![Comparison of the 1962 US Standard Atmosphere graph of geometric altitude against air density, pressure, the speed of sound and temperature with approximate altitudes of various objects.[1]](/images/13/b8/13b87ffec9fb64c16c8b033aad48effd147a758bcd72ca7cace4f9f9eff294a6.webp)
地表付近の温度測定と変動要因
地上での気温測定は、外部からの直射日光や輻射熱を遮断するため、標準化された白い通気性シェルター(スティーブンソン・スクリーン)の中で行われます。日々の平均気温は、連続記録計による測定や、一定間隔でのサンプリング、あるいは最高・最低気温の平均値を用いて算出されますが、測定タイミングによっては最大1°C程度の誤差が生じることがあります。
また、風のない晴れた夜には、地表よりも数十センチ上の地点で最低気温が観測される現象が知られています。これは1932年にL.A.ラムダスによって報告されたもので、大気中のエアロゾルによる熱放射と地表付近の対流伝熱の相互作用によるもので、この層はラムダス層と呼ばれます。
温度範囲(気温差)を決定する要素
1日の最高気温と最低気温の差(日較差)や、月・年単位の温度変動は、以下の要因に左右されます。
- 平均気温および平均湿度
- 風のパターン(強度、持続時間、温度など)
- 海などの大きな水体への近接性
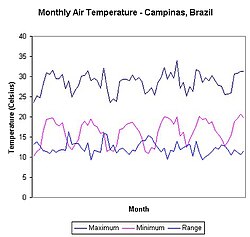
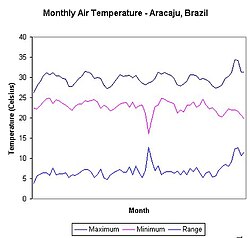
例えばブラジルの事例では、内陸のカンピーナス市(南緯22度)に比べ、赤道に近い沿岸のアラカジュ市(南緯10度)の方が、年間の温度変動が非常に小さく、平均気温が高い傾向にあります。これは緯度、熱帯気候、一定の穏やかな風、そして海に近いという地理的条件が影響しています。
地球規模の温度トレンド
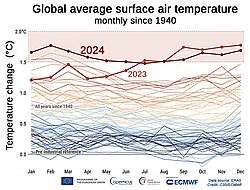
気候学における「地球温度」とは、地表や対流圏の測定値を基にした世界平均温度を指します。これらは地上観測所や衛星による計測データをコンピュータモデルで統合して算出されます。また、数万年単位の古気候を分析する場合は、氷床コアなどのプロキシデータ(代替指標)を用いて推定されます。
大気温度の概要まとめ
| 大気層 | 高度範囲(目安) | 温度変化の傾向 | 主な特徴 |
|---|---|---|---|
| 対流圏 | 地表 〜 約11km | 上昇とともに低下 | 気象現象が発生する層 |
| 成層圏 | 約11km 〜 約50km | 高度20km以降は上昇 | オゾン層による紫外線吸収 |
| 中間圏 | 約50km 〜 約85km | 上昇とともに低下 | 大気圏で最も低温な領域 |
| 熱圏 | 約85km 〜 外圏 | 上昇とともに上昇 | 強い電離放射の影響を受ける |
Frequently Asked Questions
なぜ対流圏では高度が上がると気温が下がるのですか?
対流圏の主な熱源は地表であり、太陽に温められた地面から熱が伝わるためです。そのため、熱源から離れる(高度が上がる)ほど温度が低下します。
成層圏で温度が上昇する理由は?
成層圏に存在するオゾン層が、太陽からの有害な紫外線を吸収して熱に変換するため、高度が上がるにつれて温度が上昇します。
ラムダス層とは何ですか?
風のない晴れた夜に、地表よりもわずかに高い位置(数十センチ上)で最低気温が観測される現象、およびその層のことです。熱放射と対流の相互作用によって生じます。
地表の気温測定に白い箱(スティーブンソン・スクリーン)を使うのはなぜですか?
直射日光や地面からの輻射熱が直接温度計に当たると、正確な「空気の温度」が測れないためです。白い塗装で日光を反射させ、通気性を確保することで、純粋な気温を測定できます。
地球の平均地表温度はどのくらいですか?
世界平均で約14°Cとされています。
References
- Geometric altitude vs. temperature, pressure, density, and the speed of sound derived from the 1962 U.S. Standard Atmosphere.
- Baker, Donald G. (June 1975). "Effect of Observation Time on Mean Temperature Estimation". Journal of Applied Meteorology. 14 (4): 471–476. :1975JApMe..14..471B. :10.1175/1520-0450(1975)014<0471:EOOTOM>2.0.CO;2.
- Ross, Sheila Loudon (11 March 2013). Weather and climate: an introduction. , Ontario, Canada. . 812064583.
{{}}: CS1 maint: location missing publisher () - Thompson, Russell D. (1998). Atmospheric Processes and Systems. .
- "Earth's Atmosphere: A Multi-layered Cake". . Archived from the original on 2019-10-06.
- "Station statistics". Agritempo (in Portuguese). Archived from the original on October 12, 2013. Retrieved October 11, 2013.
- Ramdas, L.A. and Atmanathan, S., 1932. The vertical distribution of air temperature near the ground at night. Beitrage zur Geophysik, v.37, pp. 116–117.
- Lake, JV (1955). "The nocturnal heat balance". Nature. 176 (4470): 32–33. :1955Natur.176...32L. :10.1038/176032b0. 4210305.
- "GISS Surface Temperature Analysis (GISTEMP)". . . Retrieved 1 September 2011.
📸 フォトギャラリー