物質が特定の波長の光(電磁波)を吸収する性質を利用して、その成分や構造を解析する手法を吸収分光法と呼びます。私たちは日常的に、物質の色を「どの光を吸収し、どの光を反射・透過させているか」の結果として見ていますが、この現象を科学的に精密に測定することで、目に見えない分子の振動や電子の状態まで明らかにすることが可能です。
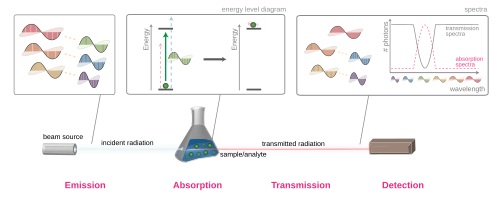
基本的には、サンプルに電磁波を照射し、透過してきた光の強度を測定することで、どの周波数のエネルギーがどれだけ吸収されたかを算出します。この結果得られるグラフが「吸収スペクトル」であり、物質ごとに固有のパターンを持つため、いわば物質の「指紋」のような役割を果たします。
Key Facts
- 物質の特定:吸収スペクトルのパターンを標準データと比較することで、未知の物質を同定できる。
- 定量分析:吸収された光の量(強度)は物質の濃度に比例するため、含有量を測定可能。
- 非接触測定:光を利用するため、サンプルに直接触れずに遠隔地から分析できる(リモートセンシング)。
- 量子力学的根拠:光のエネルギーが分子や原子のエネルギー準位の差と一致したときにのみ吸収が起こる。
吸収のメカニズムと理論
物質が光を吸収するのは、照射された光のエネルギー(光子)が、原子や分子内部の量子状態のエネルギー差とちょうど一致したときです。このエネルギーを受け取った粒子は、より高いエネルギー状態へと「励起」されます。このとき、吸収される特定の周波数は「吸収線」として現れます。
エネルギー領域による変化の種類
吸収される電磁波の波長(エネルギー)によって、物質内部で起こる変化の種類が異なります。
- マイクロ波領域:分子全体の回転状態が変化する「回転遷移」が起こります。
- 赤外線領域:分子内の結合が伸び縮みする「振動遷移」が起こります。
- 可視光・紫外線領域:電子が異なる軌道へ移動する「電子遷移」が起こります。
- X線領域:原子の深い内殻電子が励起されます。
これらの遷移は単独で起こるだけでなく、回転と振動が同時に起こるなど、組み合わさることでより複雑なスペクトルを形成します。
スペクトルの形状を左右する要因
吸収線の位置や強度は、物質の化学構造だけでなく、周囲の環境にも影響を受けます。例えば、温度や圧力の変化、電場や磁場の存在によって、吸収線の位置がわずかにずれたり、幅が広がったりすることがあります。また、気体状態よりも液体や固体状態の方が、隣接する分子同士の相互作用が強いため、吸収線は幅広く(ブロードに)なる傾向があります。
電磁波の種類と分光法の分類
利用する電磁波の波長域によって、分析できる情報と手法が異なります。以下の表に主要な分類をまとめます。
| 電磁波の種類 | 分光法の名称 | 主な分析対象・目的 |
|---|---|---|
| X線 | X線吸収分光法 | 内殻電子の励起、局所構造解析 |
| 紫外線・可視光 | UV-Vis吸収分光法 | 電子状態、有機化合物の定量 |
| 赤外線 | IR(赤外)吸収分光法 | 分子振動、官能基の特定 |
| マイクロ波 | マイクロ波吸収分光法 | 分子の回転状態、結合長・角度 |
| 電波 | NMR / ESR分光法 | 核スピン・電子スピンの状態 |
幅広い応用分野
化学分析と定量
吸収分光法は、混合物の中から特定の成分を抽出して特定する能力に長けています。例えば、赤外線ガス分析計を用いれば、空気中の窒素や酸素などの主要成分から、微量の汚染物質だけを識別して検出できます。また、Beer-Lambert(ベール・ランベルト)の法則を用いることで、吸収強度から物質の絶対濃度を算出することが可能です。
リモートセンシングと天文学
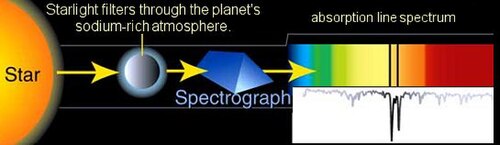
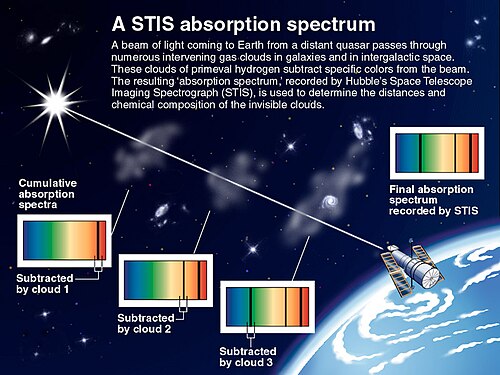
この技術の最大の利点の一つは、サンプルに触れる必要がないことです。これにより、有害物質の測定や、地球から遠く離れた天体の分析が可能になります。天文学では、恒星の前を惑星が通過する際に、惑星の大気が恒星の光を吸収する現象を捉えることで、その惑星にどのようなガスが存在し、どのような温度や圧力であるかを推定しています。
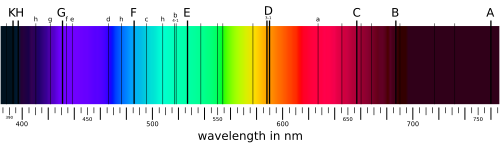
また、太陽などの恒星スペクトルに見られる暗い線(フラウンホーファー線)は、恒星の外層にある低温ガスが特定の波長を吸収した結果であり、これにより遠方の星の組成を判明させることができます。

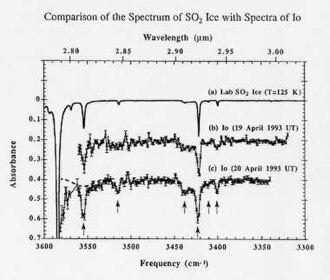
さらに、地球上の観測装置を用いて、衛星や航空機から大気中の微量ガス分布を測定する手法(微分光吸収分光法など)も普及しています。
物理学への寄与
量子力学的なモデルと実測値を照らし合わせることで、分子の幾何学的構造や電子状態を精密に決定できます。歴史的には、水素原子の吸収スペクトルで発見された「ラム・シフト」が、量子電磁力学の発展を促し、微細構造定数の決定に寄与した例もあります。
実験的なアプローチ
一般的な測定手順は、まず光源から放射された光の「参照スペクトル」を測定し、次にサンプルを配置して「サンプルスペクトル」を測定します。この2つを比較することで、光源自体の特性や検出器の感度ムラを排除し、純粋にサンプルによる吸収分光のみを抽出します。
光源には、広帯域な光を出す黒体放射源や水銀ランプ、あるいは波長を精密に制御できるレーザーなどが使われます。検出側では、波長を分けるための分光器や、干渉を利用して高速にスペクトルを得るフーリエ変換赤外分光法(FT-IR)などの技術が活用されています。
Frequently Asked Questions
吸収スペクトルと透過スペクトルの違いは何ですか?
これらは本質的に同じ情報を別の視点から見たものです。透過スペクトルは「どれだけ光が通り抜けたか」を示し、吸収が弱い波長で強度が最大になります。一方、吸収スペクトルは「どれだけ光が取り込まれたか」を示し、吸収が強い波長で強度が最大になります。数学的な変換によって相互に変換可能です。
放出(エミッション)スペクトルとはどう関係していますか?
放出は、励起された状態の物質がエネルギーを放出して基底状態に戻る現象です。一般に、吸収が起こる波長で放出も起こるため、放出スペクトルから吸収線を推定できます。ただし、強度のパターンは異なるため、アインシュタイン係数などの物理定数を用いて計算する必要があります。
なぜ気体よりも液体や固体の方がスペクトルの線が太くなるのですか?
液体や固体では、分子同士が非常に近い距離にあり、互いに強い相互作用を及ぼし合います。この相互作用によってエネルギー準位がわずかに変動し、吸収される波長の範囲が広がるため、結果として吸収線が幅広くなる(ブロードになる)傾向があります。
リモートセンシングにおける最大の課題は何ですか?
サンプルと検出器の間にある「背景」の干渉です。例えば大気中の水蒸気や二酸化炭素などが、目的のサンプルの吸収線を隠してしまったり、混ざり合ったりすることがあります。また、光源が太陽光などの自然光である場合、光源自体のスペクトル変動を区別して取り除く必要があります。
References
- Kumar, Pranav (2018). Fundamentals and Techniques of Biophysics and Molecular biology. New Delhi: Pathfinder publication. p. 33. .
- Modern Spectroscopy (Paperback) by J. Michael Hollas
- Symmetry and Spectroscopy: An Introduction to Vibrational and Electronic Spectroscopy (Paperback) by Daniel C. Harris, Michael D. Bertolucci
- Spectra of Atoms and Molecules by Peter F. Bernath
- James D. Ingle Jr. and Stanley R. Crouch, Spectrochemical Analysis, Prentice Hall, 1988,
- "Gaseous Pollutants – Fourier Transform Infrared Spectroscopy". Archived from the original on 2012-10-23. Retrieved 2009-09-30.
- Wadati, Hiroki (2026). "Teaching light absorption and the Beer–Lambert law using everyday materials: a tomato juice experiment for introductory physics". Physics Education. 61: 025016. :2509.04163. :10.1088/1361-6552/ae3f71.
- Khalafinejad, S.; Essen, C. von; Hoeijmakers, H. J.; Zhou, G.; Klocová, T.; Schmitt, J. H. M. M.; Dreizler, S.; Lopez-Morales, M.; Husser, T.-O. (2017-02-01). "Exoplanetary atmospheric sodium revealed by orbital motion". Astronomy & Astrophysics. 598: A131. :1610.01610. :2017A&A...598A.131K. :10.1051/0004-6361/201629473. 0004-6361. 55263138.
- de Wit, Julien; Seager, S. (19 December 2013). "Constraining Exoplanet Mass from Transmission Spectroscopy". Science. 342 (6165): 1473–1477. :1401.6181. :2013Sci...342.1473D. :10.1126/science.1245450. 24357312. 206552152.
📸 フォトギャラリー