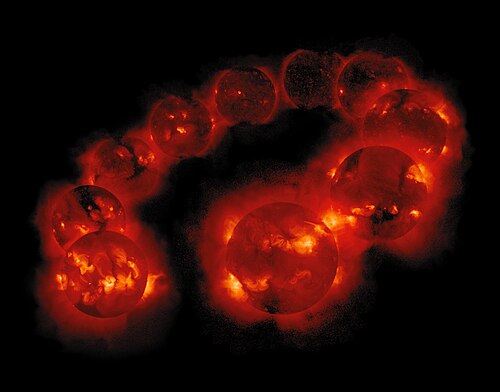
私たちの生命を支える太陽は、一定の状態で光り続けているわけではありません。実際には、太陽サイクル(別名:シュヴァーベ周期)と呼ばれる約11年周期の活動変動を繰り返しています。このサイクルは、太陽表面に現れる「黒点」の数の増減によって観測され、太陽の磁気活動の強弱を反映しています。
活動が最も活発な「極大期」から、静穏な「極小期」へと移行し、再び極大期へ戻るこの一連の流れは、単なる視覚的な変化に留まりません。太陽放射の量や、太陽フレア、コロナ質量放出(CME)といった激しい現象の発生頻度も、このサイクルに同期して変動します。
Key Facts
- 基本周期: 約11年ごとに活動の強弱が繰り返される。
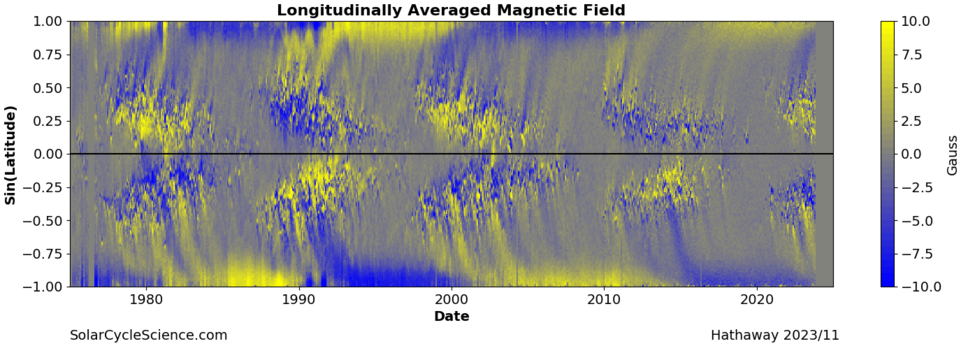
- 磁場の反転: 各サイクルの極大期付近で太陽の磁極が入れ替わる。
- ハールサイクル: 磁場が元の状態に戻るまでには2サイクル(約22年)を要する。
- 地球への影響: 宇宙天気の変動を通じて、通信インフラや地球の大気、気候に影響を与える可能性がある。
- 長期的な安定性: 化石記録によれば、このサイクルは少なくとも7億年前から安定して存在している。
太陽活動のメカニズムと観測の歴史
太陽サイクルの正体は、太陽内部で生成される磁場のダイナミクスです。サイクルが進むにつれ、磁場は複雑に絡み合い、最終的に極性が反転します。この現象は古くからオーロラの出現頻度や太陽の見た目の変化として知られていましたが、科学的に明確に特定されたのは1843年のことでした。
![A drawing of a sunspot in the Chronicles of John of Worcester, c. 1100[33]](/images/96/0b/960be2fb79c9621f048e5b5439bcb0bb8893b93ced989bfb19bc237bcd1d62ef.jpg)
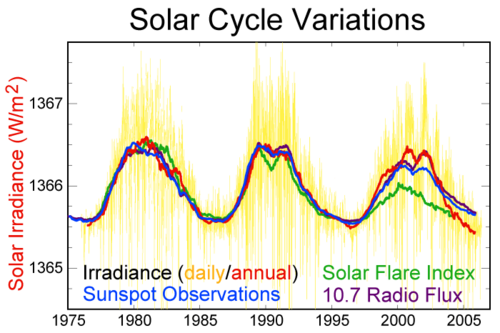
現代の天文学では、黒点数だけでなく、10.7cm電波フラックスや全太陽放射強度(TSI)などの指標を用いて活動レベルを測定しています。これらの指標は互いに密接に連動しており、太陽の活動状態を多角的に把握することを可能にしています。
黒点と磁場の関係
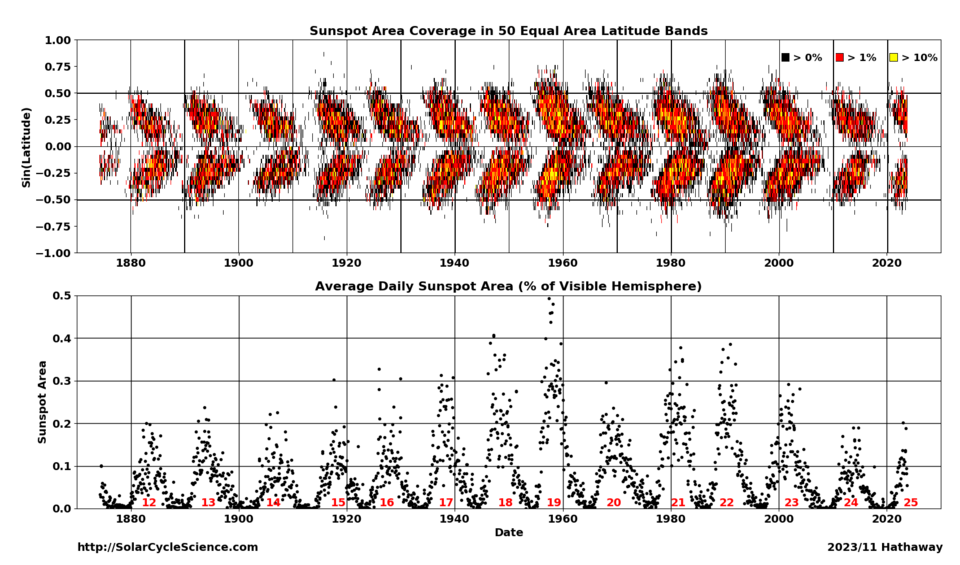
黒点は、強力な磁場が太陽表面に突き出した部分であり、周囲よりも温度が低いため黒く見えます。これらの黒点は、サイクルを通じて特定の緯度から現れ、次第に赤道方向へ移動するという特徴的なパターン(バタフライ図)を描きます。
歴史的な活動変動と特筆すべきサイクル
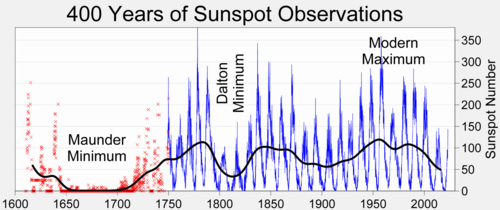
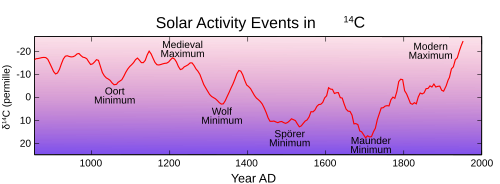
太陽活動は常に一定の振幅で繰り返されるわけではなく、数十年から数千年のスパンで活動が極端に低下する「極小期」や、逆に活発になる「極大期」が存在します。例えば、17世紀に発生した「マウンダー極小期」は、黒点がほとんど観測されなかった特異な期間として知られています。
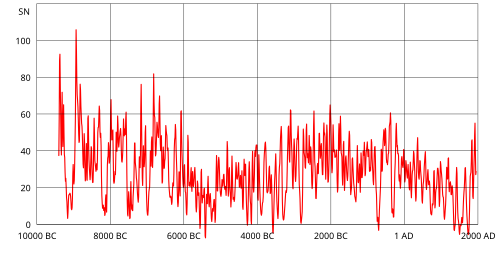
また、過去11,400年間のデータを見ると、現在のような高い活動レベルにあった期間は全体のわずか10%程度に過ぎず、多くの高活動期は現在よりも短期間であったことが示唆されています。
近年のサイクル分析(サイクル23・24)
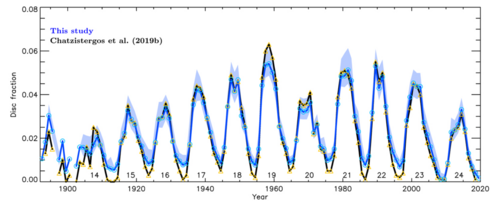
直近のサイクル23は11.6年続き、最大黒点数は120.8に達しました。一方、2008年に始まったサイクル24は、2019年に終了するまで約11年でしたが、活動レベルは低く、サイクル14(1906年)以来の最小規模となりました。特にサイクル24では、2011年と2014年の2回ピークが現れる「ダブルピーク」という珍しい現象が観測されました。
!["The prediction for solar cycle 24 gave a smoothed sunspot number maximum of about 101 in the late 2013. The smoothed sunspot number reached 116.4 in April 2014. This will probably become the official maximum. This second peak surpassed the level of the first peak (98.3 in March 2012). Many cycles are double peaked but this is the first in which the second peak in sunspot number was larger than the first. We are currently over seven years into cycle 24. The predicted and observed size made this the smallest sunspot cycle since cycle 14, which had a maximum smoothed number of 107.2 in February of 1906."[1]](/images/43/91/4391aa3b4596ab51b48081f93952882f85a8da9faf67ba7ff8e9802fae675f06.gif)
太陽活動が地球と宇宙に及ぼす影響
太陽サイクルの変動は、地球を取り巻く宇宙環境(宇宙天気)を劇的に変化させます。活動極大期には、強力な太陽フレアやコロナ質量放出が頻発し、地球の磁気圏を乱します。
![An overview of three solar cycles shows the relationship between the solar cycle, galactic cosmic rays, and the state of Earth's near-space environment.[44]](/images/60/2b/602b0ddc1c7e3da6fed3f43a75bb768181ebc7f5b1f29e022888fc1a9c15fad0.jpg)
技術インフラへの影響
激しい太陽活動は、電離層を乱すことで短波通信に障害をきたしたり、GPSなどの衛星測位システムの精度を低下させたりします。また、人工衛星の電子機器にダメージを与え、最悪の場合は運用不能に陥らせるリスクがあります。
地球環境と気候への影響
太陽放射量の変動(約0.1%)は、地球の平均気温にわずかながら影響を与えます。研究によれば、極大期と極小期の間で地球の平均気温に約0.18 ± 0.08 Kの変動があるとの指摘があります。また、銀河宇宙線の流入量がサイクルによって変化し、それが雲の形成や大気の状態に影響を及ぼすという説も議論されています。
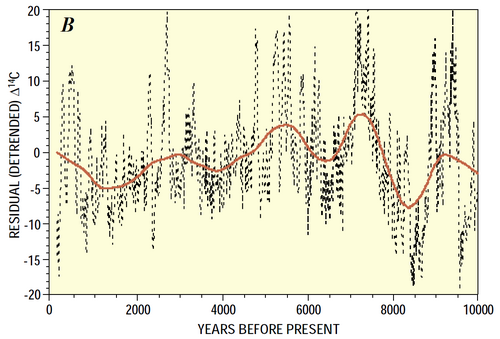
太陽活動の歴史的変動まとめ
| イベント名 | 開始時期 | 終了時期 | 特徴 |
|---|---|---|---|
| ホメロス極小期 | 紀元前750年 | 紀元前550年 | 古代の活動低下期 |
| 中世極大期 | 1100年 | 1250年 | 長期的な活動活発期 |
| マウンダー極小期 | 1645年 | 1715年 | 黒点が極端に減少した期間 |
| ダルトン極小期 | 1790年 | 1820年 | 19世紀初頭の活動低下期 |
| 現代極大期 | 1933年 | 2008年 | 近現代の非常に活発な期間 |
Frequently Asked Questions
太陽サイクルが11年である理由は?
太陽内部の対流層で磁場が生成・輸送される「太陽ダイナモ」というメカニズムによるものです。磁場が蓄積し、表面に現れ、その後反転して消滅するまでの一連のプロセスに約11年かかります。
黒点が多いと地球に危険があるのか?
黒点数が多いことは太陽活動が活発であることを意味し、大規模な太陽フレアが発生しやすくなります。これにより通信障害や停電などのリスクが高まりますが、地球の磁場と大気が保護しているため、地上の人間が直接的な健康被害を受けることはまずありません。
ハールサイクルとは何ですか?
太陽の磁場が完全に元の状態(極性)に戻るまでの周期のことです。1つの太陽サイクルで磁極が反転するため、元の向きに戻るには2サイクル分、つまり約22年の期間が必要となります。
太陽活動は地球の温暖化に関係していますか?
太陽放射の変動は地球の気温に影響を与えますが、その変動幅は非常に小さい(約0.1%)ものです。長期的な気候変動の一因にはなり得ますが、近年の急激な温暖化の主因とは考えられていません。
サイクル25はどのような状態ですか?
2019年12月頃から始まった最新のサイクルです。過去の傾向に基づき、観測機関がその活動レベルを継続的にモニタリングしています。
References
- Hathaway, David (23 March 2017). "Solar Cycle Prediction". Marshall Space Flight Center – Solar Physics. National Aeronautics and Space Administration. Archived from the original on 7 February 2018.
 This article incorporates text from this source, which is in the .
 - Haigh, Joanna D. (2007). "The Sun and the Earth's Climate". Living Reviews in Solar Physics. 4 (1): 2. :2007LRSP....4....2H. :10.12942/lrsp-2007-2.
- ; Ding, Y.; Griggs, D.J.; Noguer, M., eds. (2001). "6.11 Total Solar Irradiance—Figure 6.6: Global, annual mean radiative forcings (1750 to present)". Climate Change 2001: Working Group I: The Scientific Basis. . Retrieved 15 April 2007.; see also the IPCC Fourth Assessment Report, in which the magnitude of variation in solar irradiance was revised downward, although the evidence of connections between solar variation and certain aspects of climate increased over the same time period: Assessment Report-4, Working group 1, chapter 2 Archived 2013-12-07 at the
- Karoff, Christoffer; Jørgensen, Carsten Sønderskov; Senthamizh Pavai, V.; Arlt, Rainer (12 June 2019). "Christian Horrebow's Sunspot Observations – II. Construction of a Record of Sunspot Positions". . 294 (6): 77. :1906.10895. :2019SoPh..294...78K. :10.1007/s11207-019-1466-y. 189841594.
- Schwabe (1843). "Sonnenbeobachtungen im Jahre 1843" [Observations of the sun in the year 1843]. Astronomische Nachrichten (in German). 21: 233–236. From page 235: "Vergleicht man nun die Zahl der Gruppen und der flecken-freien Tage mit einander, so findet man, dass die Sonnenflecken eine Periode von ungefähr 10 Jahren hatten" ('If one compares the number of groups [of sunspots] and the sunspot-free days with one another, then one finds that the sunspots had a period of about 10 years')
- Wolf, R. (1852). "Neue untersuchungen über die periode der sonnenflecken und ihre bedeutung" [New investigations regarding the period of sunspots and its significance]. Mittheilungen der Naturforschenden Gesellschaft in Bern (in German). 255: 249–270.
- (June 1976). "The Maunder Minimum". . 192 (4245): 1189–1202. :1976Sci...192.1189E. :10.1126/science.192.4245.1189. 1742583. 17771739. 33896851.
- David H. Hathaway, "The Solar Cycle", Living Reviews in Solar Physics, March 2010, Max Planck Institute for Solar System Research, Katlenburg-Lindau, Germany. ISSN 1614-4961 (accessed 19 July 2015)
- "Sunspot Number graphics". Solar Influences Data Analysis Center. .
- Wu, C.J.; Krivova, N.; Solanki, S.K.; Usoskin, I.G. (2018). "Solar total and spectral irradiance reconstruction over the last 9000 years". Astronomy & Astrophysics. 620: A120. :1811.03464. :2018A&A...620A.120W. :10.1051/0004-6361/201832956.
 This article incorporates text from this source, which is in the .
📸 フォトギャラリー