地球温暖化への対策が急務となる中、化石燃料に依存しない再生可能エネルギーへの転換が世界的に加速しています。自然界に常に存在するエネルギー源を利用するこれらの技術は、温室効果ガスの排出を抑制し、環境負荷を低減させる鍵となります。近年では技術革新によるコスト低下が進み、経済的な合理性を持って導入が進んでいます。
主要な事実(Key Facts)
- 太陽光発電は世界的に導入容量が急増しており、2025年には2,391.6 GWに達しています。
- 風力発電の導入容量は2023年時点で1,017.2 GWとなり、安定した成長を続けています。
- 水力発電は再生可能エネルギーの中で大きなシェア(2023年時点で14.3%)を占める基幹電源です。
- コスト低下:太陽光パネルの価格は、累積導入量の倍増に伴い約20%低下するという「スワンソンの法則」に従い、大幅に安価になっています。
- 環境・健康への影響:化石燃料の使用による死亡リスクは、再生可能エネルギーの生産に伴うリスクを大幅に上回っています。
再生可能エネルギーの主要技術と特性
太陽光エネルギー
太陽光発電(PV)は、光電効果を利用して直接電気を得る技術です。設置の柔軟性が高く、大規模な発電所から住宅の屋根まで幅広く活用されています。また、農地の上にパネルを設置する「営農型太陽光発電(アグリボルタイクス)」や、水面に浮かべる「水上太陽光発電(フロートボルタイクス)」など、土地利用を効率化する手法も普及しています。
![Renewable energy capacity has steadily grown, led by solar photovoltaic power.[58]](/images/0d/21/0d21347ead30dc955d02978f0b5ede3ac43fd8a5dd84a3a71752d9a24d540579.webp)
![Swanson's law–stating that solar module prices have dropped about 20% for each doubling of installed capacity—defines the "learning rate" of solar photovoltaics.[70][71]](/images/db/66/db66f742faf199af69d545180607b7dddbcce3deedc076c7bed16623a6c40c54.webp)
風力エネルギー
風の力でタービンを回転させ発電する風力発電は、陸上だけでなく洋上への展開が進んでいます。地域的な風況に左右されますが、大規模な風力発電所(ウィンドファーム)を構築することで、効率的な電力供給が可能です。
![Wind energy generation by region over time[99]](/images/ad/de/adde6c78248c5f642f5f12578cbf2ec8646d8717046a1c1feb14775025a62223.webp)
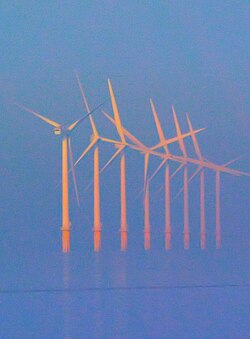
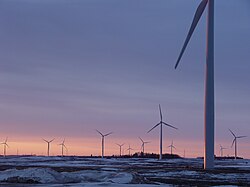
水力および海洋エネルギー
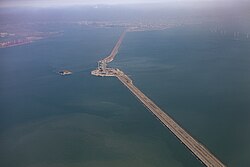
水力発電はダムなどを利用して水の落差で発電する、信頼性の高いエネルギー源です。さらに、潮汐(潮の満ち引き)や波力、海洋温度差などを利用した海洋エネルギーの開発も進んでおり、安定した電力供給への寄与が期待されています。
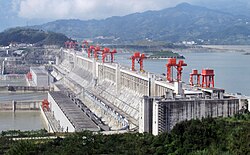
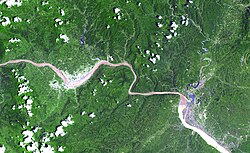
バイオエネルギーと地熱エネルギー
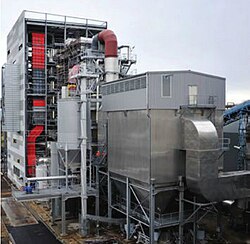
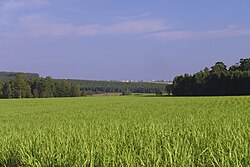
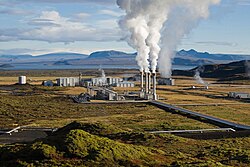
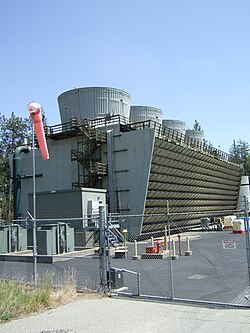
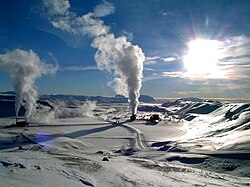
生物資源(バイオマス)から得られる燃料や、地球内部の熱を利用する地熱発電は、天候に左右されにくい「ベースロード電源」としての特性を持ちます。バイオ燃料は輸送部門の脱炭素化に、地熱は地域的な熱供給や発電に活用されています。

エネルギー供給の課題と解決策
間欠性の克服と貯蔵技術
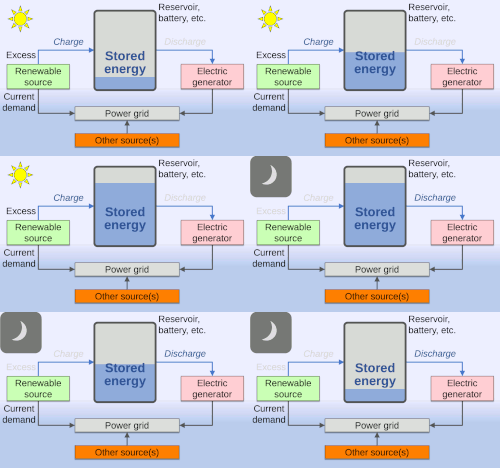
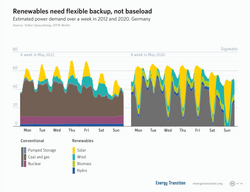
太陽光や風力などの自然エネルギーは、天候や時間帯によって発電量が変動する「間欠性」という課題があります。これを解決するため、電気を化学エネルギーとして蓄える蓄電池や、余剰電力を利用して水素を製造する技術、また水力発電を利用した揚水発電などのエネルギー貯蔵システムが不可欠です。
効率的な送電網(スーパーグリッド)
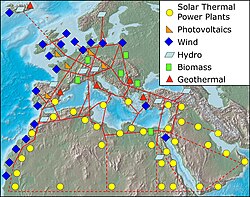
発電に適した場所と消費地が離れていることが多いため、広域的に電力を融通し合う「スーパーグリッド」の構想が進んでいます。これにより、地域間の需給バランスを最適化し、エネルギーセキュリティを高めることができます。
経済性と社会的な影響
再生可能エネルギーの普及は、単なる環境対策に留まらず、経済的な「正のフィードバック」を生み出しています。導入量が増えることで規模の経済が働き、コストが低下し、それがさらなる需要を喚起するという「好循環(virtuous cycle)」が形成されています。
![Production of technology such as renewable energy sources starts a positive feedback loop to form what has been called a virtuous cycle—the opposite of a vicious cycle. For example, as more and more solar modules are deployed, prices fall because of the economies of scale, allowing the technology to become cost-competitive in new applications that in turn increase demand for more deployment.[190]](/images/ef/56/ef5622702a02f6c6e85fb7698d4c10ff8c44ef268d909fb372faba89f28ed450.webp)
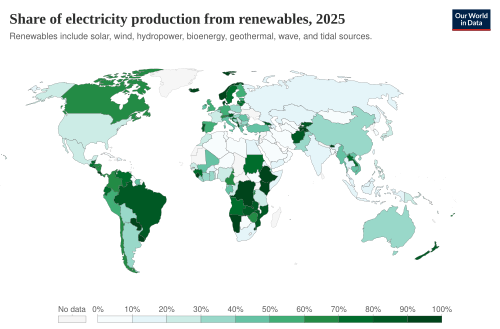
![Though the share of electricity generation from renewables has increased since 2010, there is substantial variance among major world regions.[191]](/images/d4/e5/d4e5fc0339971d96142afcd17f6724e4cfd26b94abe0f82b95f488798e269cd8.webp)
![In 2025, growth in solar, wind and other low-carbon electric power exceeded the overall growth in demand for electricity, reducing reliance on fossil fuels and helping to curb greenhouse gas emissions.[192]](/images/f5/9d/f59d91a5bf5f8cbda7a26cf5dbaf635586f597a2e79f311dda37e164cadb1d95.webp)
また、健康面でのメリットも大きく、大気汚染の原因となる化石燃料からの脱却は、公衆衛生の向上に直結します。
![Deaths caused as a result of fossil fuel use (areas of rectangles in chart) greatly exceed those resulting from production of renewable energy (rectangles barely visible in chart).[254]](/images/88/0d/880d14824f925f4ec2586a0ade0ab8a7fd809fc80eb7ed16ea517f423f5ae31c.webp)
社会的な受容性と議論
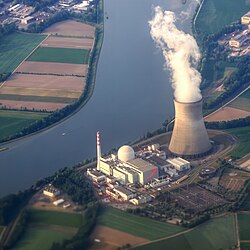
一方で、発電施設の建設に伴う景観の変化や環境への影響、また原子力発電を再生可能エネルギーに含めるかといった定義を巡る議論など、社会的な合意形成が重要な課題となっています。
![Acceptance of wind and solar facilities in one's community is stronger among U.S. Democrats (blue), while acceptance of nuclear power plants is stronger among U.S. Republicans (red).[312]](/images/5c/b7/5cb7c669cd2ecaf210987cee26a41e39db9ce36a0ddb738370ed3bf825c7bf74.webp)
主要エネルギー源の比較まとめ
| エネルギー源 | 世界導入容量 (目安) | 発電シェア (2023) | 主な用途 | コスト傾向 (2010-19) |
|---|---|---|---|---|
| 太陽光 (PV) | 2,391.6 GW | 5.5% | 電力、給湯、空調 | 大幅低下 (-82%) |
| 風力 | 1,017.2 GW | 7.8% | 電力、揚水 | 低下 (-38% 陸上) |
| 水力 | 1,267.9 GW | 14.3% | 電力、揚水発電 | 上昇 (+27%) |
| バイオエネルギー | 150.3 GW | 2.4% | 電力、熱、輸送燃料 | 低下 (-13%) |
| 地熱 | 14.9 GW | 1%未満 | 電力、暖房 | 上昇 (+49%) |
Frequently Asked Questions
再生可能エネルギーの最大の弱点は何ですか?
太陽光や風力に見られる「発電量の変動(間欠性)」です。天候や時間帯によって電力が不安定になるため、蓄電池による貯蔵や、異なるエネルギー源を組み合わせた分散型電源の構築が必要です。
なぜ太陽光発電のコストは急激に下がったのですか?
「スワンソンの法則」に代表されるように、導入容量が倍増するたびに製造コストが低下する学習効果と、量産による規模の経済が働いたためです。
バイオエネルギーは本当にカーボンニュートラルなのですか?
植物が成長過程で吸収した二酸化炭素を燃焼時に放出するため、理論上の排出量はゼロとみなされます。ただし、栽培時の肥料や輸送にかかるエネルギーを含めたライフサイクル全体での評価が重要です。
原子力発電は再生可能エネルギーに含まれますか?
定義によって異なります。温室効果ガスを排出しない「低炭素エネルギー」としては共通していますが、資源の有限性や廃棄物処理の観点から、再生可能エネルギーに含めるかについては世界的に議論が分かれています。
再生可能エネルギーの導入による環境リスクはありますか?
設備建設時の森林伐採や、太陽光パネルや風力タービンの製造に必要な鉱物資源の採掘が、地域の生物多様性に影響を与える可能性があります。持続可能な開発のためには、環境影響評価に基づいた適切な設置場所の選定が不可欠です。
References
- ; (2011). "Towards an electricity-powered world". . 4 (9): 3193–3222. :2011EnEnS...4.3193A. :10.1039/c1ee01249e.
- Armaroli, Nicola; Balzani, Vincenzo (2016). "Solar Electricity and Solar Fuels: Status and Perspectives in the Context of the Energy Transition". . 22 (1): 32–57. :2016ChEuJ..22...32A. :10.1002/chem.201503580. 26584653.
- "Global renewable energy trends". Deloitte Insights. Archived from the original on 29 January 2019. Retrieved 28 January 2019.
- "Renewable Energy Now Accounts for a Third of Global Power Capacity". irena.org. 2 April 2019. Archived from the original on 2 April 2019. Retrieved 2 December 2020.
- "2023 Levelized Cost Of Energy+". www.lazard.com. Retrieved 10 June 2024.
- IEA (2020). Renewables 2020 Analysis and forecast to 2025 (Report). p. 12. Archived from the original on 26 April 2021. Retrieved 27 April 2021.
- "Renewables 2022". Global Status Report (renewable energies): 44. 14 June 2019. Archived from the original on 24 May 2019. Retrieved 5 September 2022.
- "Global Electricity Review 2025". Ember. Retrieved 11 April 2025.
- "Renewables - Energy System". IEA.
- ; ; Rosado, Pablo (January 2024). "Renewable Energy". .
📸 フォトギャラリー