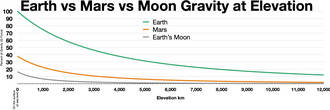
火星の重力は、地球よりもはるかに弱く、その特性を分析することで、目に見えない惑星内部の構造や地質学的な履歴を読み解くことができます。質量が地球より小さいため、火星表面での平均重力加速度は3.721 m/s²であり、これは地球の約38%に相当します。この重力のわずかな変動を精密に測定することで、科学者は地殻の厚さや核の状態、さらには季節による質量の移動までを特定しています。
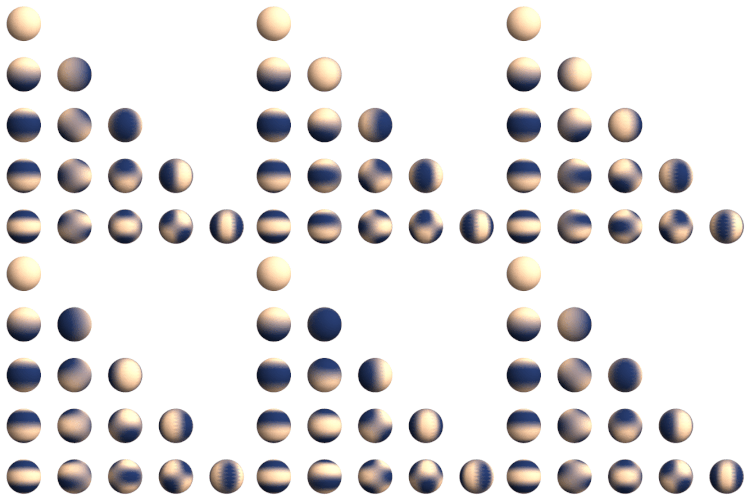
重力の測定には、主に周回衛星の軌道変動を追跡する無線追跡データが用いられます。衛星が受ける重力の変化は、惑星内部の密度分布を反映しており、これを数学的な「球関数(Spherical Harmonics)」を用いてモデル化することで、全球的な重力マップが作成されます。
Key Facts
- 平均重力: 3.721 m/s²(地球の約38%)。
- 最新モデル: 2016年に発表されたGMM-3(Goddard Mars Model 3)が最高精度。
- 内部構造: 潮汐変形の分析から、核の外層は液体である可能性が高い。
- 地殻の厚さ: 全球的に変動しており、北半球は薄く、南半球は厚い傾向がある。
- 季節変動: 二酸化炭素の昇華と凝結による極冠の質量変化が重力に影響を与える。
重力場の測定とモデルの進化
火星の重力場を把握するためには、高度な計算モデルが必要です。初期のモデルは低次な球関数を用いていましたが、観測技術の向上とともに解像度は飛躍的に高まりました。最新のGMM-3モデルでは、Mars Global Surveyor (MGS)、Mars Odyssey、Mars Reconnaissance Orbiter (MRO) の16年間にわたるデータと、MOLA(火星軌道レーザー高度計)による地形データを統合し、115kmの全球解像度を実現しています。
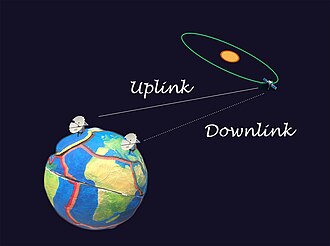
これらのデータは、ドップラー追跡などの無線通信技術によって得られます。送信機と受信機の間で信号の周波数変化を測定することで、衛星の速度変化、すなわち重力による加速を極めて精密に検出できるためです。
重力モデルの変遷
| モデル名 | 発表年 | 球関数の次数/帯域 | 主なデータソース |
|---|---|---|---|
| Geoide martien | 1982 | 18 | Mariner 9, Viking 1 & 2 |
| GMM-1 | 1993 | 50 | Mariner 9, Viking 1 & 2 |
| GMM-2B | 2001 | 80 | MGS, MOLA地形データ |
| MGS95J | 2006 | 95 | MGS, Mars Odyssey, MOLA |
| GMM-3 | 2016 | 120 | MGS, Odyssey, MRO |
重力異常と地質学的要因
火星の重力は均一ではなく、場所によって「重力異常」が生じています。これには大きく分けて、地形の影響をそのまま反映したフリーエア異常と、地形の質量を補正したブーゲー異常があります。
![Mars free-air gravity map produced along with the GMM-3 gravity solution[13] (Red: gravity high; Blue: gravity low) (Credit: NASA's Scientific Visualization Studio)](/images/7d/27/7d27fd6fc994bda36a84fb606e2bebe56d0b9db0419109aa5938859384eeb50f.jpg)
短波長の重力異常は主に地形によるアイソスタシー(地殻の均衡)によって制御されています。一方で、惑星規模の長波長異常は、マントルの対流や強度に起因すると考えられています。また、火山活動による高密度物質の貫入や、巨大衝突による地殻の隆起、地殻の多孔質性の違いなども、局所的な重力変動を引き起こす要因となります。
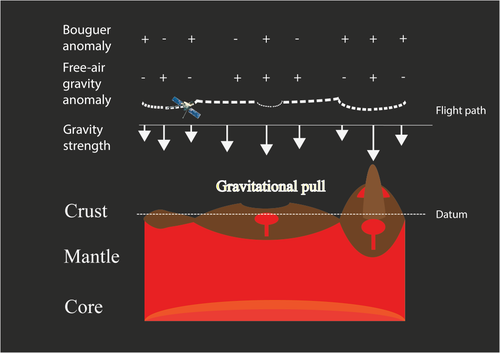
ブーゲー異常マップを分析すると、地殻内部の密度分布が明らかになります。これにより、表面の地形だけでは分からない地下の構造を推測することが可能です。
 (Credit: NASA's Scientific Visualization Studio)](/images/24/c7/24c7eb48fc409220db7c8c6b968a2c57b7981c8165ab6ad207caa05607be6276.jpg)
地形と重力の相関
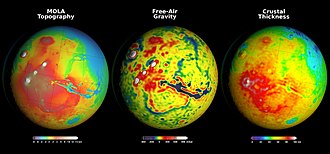
火星では、特定の地域で地形の起伏と重力異常に強い相関が見られます。例えば、火山地帯では正の異常(重力が強い)が、深い盆地では負の異常(重力が弱い)が観測される傾向にあります。また、地形モデルMEDGRsなどのデータを用いることで、オリンポス山のような最高点からヘラス盆地のような最低点まで、詳細な高度分布と重力の関係を分析できます。
![The topography model MEDGRs was developed through range (distance) measurement done by MOLA 2 instrument and radio tracking data of the Mars Global Surveyor (MGS).[36] The highest point is located at the Olympus Mons while the deepest point is located within the Hellas Basin.[36](Brown-Red: Topography high; Green-Blue: Topography low) (Credit: NASA/JPL-Caltech)](/images/ae/fa/aefaebdd4c21518231516f4e07ab47d63b3f1d469135641e122e05d2b2ed2266.jpg)
時間的に変動する重力場
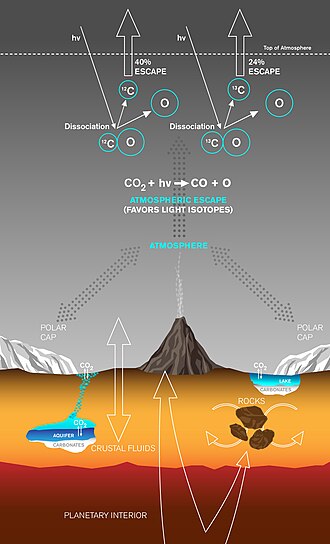
火星の重力は静的なものではなく、時間とともに変化します。最も顕著なのは、極冠における二酸化炭素(CO₂)の季節的なサイクルです。冬に極地に凝結したCO₂が夏に昇華して大気へ戻ることで、極地方の質量が変動し、それが重力場の変化として検出されます。
また、太陽や衛星フォボスによる潮汐力も重要な指標となります。火星がこれらの天体によってどれだけ変形するかを示す「ラブ数(Love number k₂)」を測定することで、内部の剛性が分かります。最新の分析ではk₂ = 0.1697 ± 0.0009とされており、これは火星の核の外層が液体であることを強く示唆しています。推定される核の半径は1520〜1840kmです。
地殻の厚さと密度に関する考察
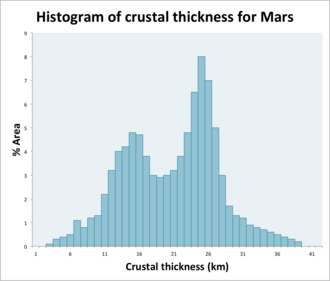
直接的な測定は困難ですが、重力データと地形データの組み合わせにより、地殻の厚さが推定されています。火星の地殻は南北で大きく異なり、北半球の低地は薄く、南半球の高地は厚いという「地殻二分性」が認められます。統計的な分析では、地殻厚のピークが32kmと58kmの2箇所に現れることが分かっています。
また、地殻の平均密度は約2582 kg/m³と推定されていますが、火山地帯などの局所的な場所では3231 kg/m³に達することもあります。この密度の差は、岩石の組成だけでなく、地殻に含まれる空隙(ポロシティ)の割合や、そこに氷や水が充填されているかによっても影響を受けます。
さらに、過去の巨大衝突によって形成された盆地では、初期の高温状態による「粘性緩和(Viscous Relaxation)」が起こり、地殻が流動的に変形して地形が平坦化したと考えられています。ただし、ヘラスやユートピアなどの超巨大盆地では、このメカニズムだけでは説明できない複雑な構造を持っています。
![After the initial impact, high heat flux and high water content would have favored viscous relaxation to take place. The crust becomes more ductile. The basin topography of the craters is thus subjected to greater stress due to self-gravitation, which further drive crustal flow and decay of relief. However, this analysis may not work for giant impact craters such as Hellas, Utopia, Argyre and Isidis basins.[25]](/images/44/e0/44e024623d1406f41714e98e1e2d2a5749a46d0e51eaa2411880e30f6f853498.png)
Frequently Asked Questions
火星の重力が地球より弱いのはなぜですか?
重力は天体の質量に比例します。火星は地球よりも質量が大幅に小さいため、表面で引きつける力(重力加速度)が弱くなり、地球の約38%にとどまっています。
重力マップから何がわかるのですか?
地表からは見えない地下の密度分布がわかります。これにより、地殻の厚さの変動、地下に眠る火山活動の痕跡、核が液体か固体かといった内部構造の推定が可能です。
火星の重力は季節によって変わるのですか?
はい、変わります。極冠にある二酸化炭素が季節に応じて凍結(凝結)したり蒸発(昇華)したりすることで、極地方の質量が移動し、それが微小な重力変動として観測されます。
「ブーゲー異常」とは具体的に何を指しますか?
観測された重力値から、地表の地形(山や谷)がもたらす質量の影響を計算して取り除いた後の「残差」のことです。これにより、地形による影響を排除して、純粋に地下の密度差による重力変化を分析できます。
火星の核の状態はどうなっていると考えられていますか?
太陽や衛星による潮汐変形を分析した結果、核の少なくとも外層は液体であると考えられています。これは、核が完全に固体である場合に比べて、天体の変形しやすさ(ラブ数)が大きいためです。
References
- Hirt, C.; Claessens, S.J.; Kuhn, M.; Featherstone, W.E. (2012). "Kilometer-resolution gravity field of Mars: MGM2011". Planetary and Space Science. 67 (1): 147–154. :2012P&SS...67..147H. :10.1016/j.pss.2012.02.006. :20.500.11937/32270.
- Watts, A. B.; Bodine, J. H.; Ribe, N. M. (1980-02-07). "Observations of flexure and the geological evolution of the Pacific Ocean basin". Nature. 283 (5747): 532–537. :1980Natur.283..532W. :10.1038/283532a0. 1476-4687. 4333255.
- Jeffreys, H. (1959). The Earth 4th ed., 420.
- Runcorn, S. K. (1965). "Changes in the Convection Pattern in the Earth's Mantle and Continental Drift: Evidence for a Cold Origin of the Earth". Philosophical Transactions of the Royal Society of London. Series A, Mathematical and Physical Sciences. 258 (1088): 228–251. :1965RSPTA.258..228R. :10.1098/rsta.1965.0037. 73348. 122307704.
- Neumann, G. A.; Zuber, M. T.; Wieczorek, M. A.; McGovern, P. J.; Lemoine, F. G.; Smith, D. E. (2004-08-01). "Crustal structure of Mars from gravity and topography" (PDF). Journal of Geophysical Research: Planets. 109 (E8): E08002. :2004JGRE..109.8002N. :10.1029/2004je002262. 2156-2202.
- Kiefer, Walter S. (2004-05-30). "Gravity evidence for an extinct magma chamber beneath Syrtis Major, Mars: a look at the magmatic plumbing system". Earth and Planetary Science Letters. 222 (2): 349–361. :2004E&PSL.222..349K. :10.1016/j.epsl.2004.03.009.
- Marty, J.C.; Balmino, G.; Duron, J.; Rosenblatt, P.; Maistre, S. Le; Rivoldini, A.; Dehant, V.; Hoolst, T. Van (2009). "Martian gravity field model and its time variations from MGS and Odyssey data". Planetary and Space Science. 57 (3): 350–363. :2009P&SS...57..350M. :10.1016/j.pss.2009.01.004.
- Smith, David E.; Zuber, Maria T.; Torrence, Mark H.; Dunn, Peter J.; Neumann, Gregory A.; Lemoine, Frank G.; Fricke, Susan K. (2009-05-01). "Time variations of Mars' gravitational field and seasonal changes in the masses of the polar ice caps". Journal of Geophysical Research: Planets. 114 (E5): E05002. :2009JGRE..114.5002S. :10.1029/2008je003267. :1721.1/74244. 2156-2202.
- Goossens, Sander; Sabaka, Terence J.; Genova, Antonio; Mazarico, Erwan; Nicholas, Joseph B.; Neumann, Gregory A. (2017-08-16). "Evidence for a low bulk crustal density for Mars from gravity and topography". Geophysical Research Letters. 44 (15): 7686–7694. :2017GeoRL..44.7686G. :10.1002/2017gl074172. 1944-8007. 5619241. 28966411.
- "CODATA Value: Newtonian constant of gravitation". The NIST Reference on Constants, Units, and Uncertainty. US . June 2015. Retrieved 2017-12-14. "2014 CODATA recommended values"
📸 フォトギャラリー