プレート内火山活動のメカニズム:マントルプルーム説とプレート説の対立
地球上の火山活動の多くは、プレートの境界付近で発生します。これは現代の地質学における定説であるプレートテクトニクス理論によって明確に説明されています。しかし、プレートの境界から遠く離れた内部で発生するプレート内火山活動(Intraplate volcanism)の起源については、専門家の間でも依然として激しい議論が続いています。
この現象を説明するために、主に「マントルプルーム説」と「プレート説」という2つの対立するモデルが提唱されています。一方は地球深部からの熱輸送を重視し、もう一方はプレート自体の構造的な要因を重視するアプローチです。
Key Facts
- プレート内火山活動とは、テクトニックプレートの縁ではなく、内部で起こる火山現象のこと。
- マントルプルーム説は、核とマントルの境界から上昇する熱い岩石の柱が地表にマグマを運ぶとする説。
- プレート説は、リソスフェア(岩石圏)の伸張や構造的な不連続性など、プレート側の要因でマグマが発生するとする説。
- ハワイやイエローストーンなどのホットスポットは、これら2つの理論の主要な検証対象となっている。
マントルプルームモデル:深部からの熱輸送
マントルプルーム説では、地球の深部、特に核とマントルの境界付近から高温の物質が上昇し、地表に到達することで火山活動が引き起こされると考えられています。このプロセスは、対流による熱輸送の一種です。
理論的なシミュレーションによれば、これらのプルームは「キノコ状」の形態を持つと予測されています。TanとThorpeの研究では、直径約2000kmの頭部を持つプルームが形成され、そのサイクルは約20億年、発生数は地球全体で約17個程度になると推計されています。
![A superplume generated by cooling processes in the mantle (LVZ=low-velocity zone)[3]](/images/8f/0a/8f0aec6fb4b400ae9b4bd686c0d9ce00d7ddb2947b3095e52b0e7ae832ca6c4f.png)
![Hydrodynamic simulation of a single "finger" of the Rayleigh–Taylor instability, a possible mechanism for plume formation.[19] In the third and fourth frame in the sequence, the plume forms a "mushroom cap". Note that the core is at the top of the diagram and the crust is at the bottom.](/images/47/01/47013746bd6ce4a281b1db389c82a5e46fefc7110c5dc80dff7c317ae34246fd.gif)
プルームの構造と地球内部
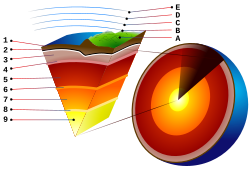
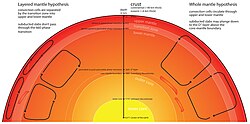
プルームは下部マントルから上昇し、上部マントルの低速度層(LVZ)を通過してリソスフェアに到達します。このとき、上昇流が地殻を押し上げ、マグマを供給することで火山島や火山列を形成します。
![Calculated Earth's temperature vs. depth. Dashed curve: Layered mantle convection; Solid curve: Whole mantle convection.[26]](/images/a7/fe/a7fe6abd6594ce506f9a30911383184031ff150b4281e57ce6ecab9ce8f581ae.png)
プルーム説を支持する証拠
この説の強力な根拠の一つが、ハワイのような線状火山列の存在です。固定されたプルームの上をプレートが移動することで、時間差を持って火山が並んで形成されると考えられています。また、希ガスの同位体分析や地震波トモグラフィーによる深部構造の可視化も、深部からの上昇流の存在を示唆しています。
![An example of plume locations suggested by one recent group.[39] Figure from Foulger (2010).[4]](/images/f0/16/f016c462d9c62434e562c8c3d98b33c5310eaf46687b3fc3930b8c59684d160a.png)
プレート説:リソスフェアの構造的要因
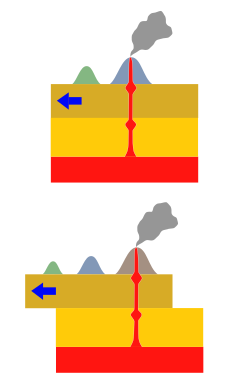
対照的にプレート説は、深部からのプルームを想定せず、プレート内部の物理的な変化や化学的な不均一性がマグマ発生の主因であると主張します。このモデルでは、リソスフェアの伸張や薄層化が、もともと存在していた潜在的な融液を上昇させるトリガーになると考えられています。
![Schematic of the plate theory. Mid-blue: lithosphere; light-blue/green: inhomogeneous upper mantle; yellow: lower mantle; orange/red: core-mantle boundary. Lithospheric extension enables pre-existing melt (red) to rise.[47]](/images/ea/4b/ea4b11dfc23be81f545e61f230f7322a8d0d412eafa429c12f89504e036eaabe.png)
マグマ発生のメカニズム
プレート説が挙げる主な要因には、以下のようなものが含まれます。
- 大陸の分裂やプレート境界の接合点における火山活動の強化
- リソスフェア下での小規模な対流や、プレートの引き裂き(スラブ・ティアリング)
- 構造的な不連続点における応力の急激な変化
- 地殻の壊滅的な薄層化による減圧融解
地域的な適用例
例えば、北大西洋地域やアメリカ北西部の地質構造は、プレート説によって説明が試みられています。特にイエローストーンの火山活動については、深部プルームではなく、ベイスン・アンド・レンジ地域の伸張運動に伴う上部マントルの影響であるとする見解があります。
![Regional map of the North East Atlantic. Bathymetry shown in colour; land topography in grey. RR: Reykjanes Ridge; KR: Kolbeinsey Ridge; JMMC: Jan Mayen Microcontinent; AR: Aegir Ridge; FI: Faroe Islands. Red lines: boundaries of the Caledonian orogen and associated thrusts, dashed where extrapolated into younger Atlantic Ocean.[66]](/images/2e/19/2e197e80f05c855b7d8328b12e1f9927f3c22ceb9c446ee56ff5bec87c2a502d.jpg)
![Geological map of northwest USA showing Basin and Range faults and basalts and rhyolites <17 Ma. Blue lines represent approximate age contours of silicic volcanic centres across the Eastern Snake River Plain and a contemporaneous trend of oppositely propagating silicic volcanism across central Oregon.[74]](/images/10/54/1054f92ac2eee40e966258d284625df58ccf826305d634c250e468402d0fd108.png)
理論の比較まとめ
両理論は、地球内部の物質循環や熱輸送の捉え方が根本的に異なります。以下にその主要な相違点をまとめます。
| 比較項目 | マントルプルーム説 | プレート説 |
|---|---|---|
| マグマの起源 | 核・マントル境界からの深部上昇流 | リソスフェアの伸張や浅部マントルの不均一性 |
| 主な駆動要因 | 熱対流(温度差による浮力) | 構造的応力・プレートの力学的変動 |
| 火山列の解釈 | 固定された熱源上のプレート移動 | プレート内部の亀裂や応力場の変化 |
| 重視する証拠 | 希ガス同位体、深部地震波トモグラフィー | 地殻の伸張履歴、浅部地質構造 |
Frequently Asked Questions
ホットスポットとは何ですか?
プレートの境界とは無関係に、特定の地点で継続的に火山活動が起こる場所のことです。プルーム説では深部の熱い上昇流の出口とされ、プレート説ではプレート内部の構造的な弱点と解釈されます。
ハワイの火山列はどのように形成されましたか?
プルーム説では、固定されたマントルプルームの上を太平洋プレートが移動したため、古い島から新しい島へと順に形成されたと説明します。一方、プレート説ではプレート内部の応力や冷却による収縮などが影響していると考えます。
マントルプルームの形状はどのようなものですか?
理論的なモデルでは、頭部が大きく、そこから細い茎のような部分が伸びる「キノコ状」の形態をしています。頭部がリソスフェアに衝突することで、大規模な洪水玄武岩などの噴火を引き起こすとされています。
プレート説ではなぜ火山ができるのですか?
プレートが引っ張られて薄くなったり、構造的な割れ目が生じたりすることで、マントルの圧力が下がり、岩石が融解してマグマが発生します。そこに既存の融液があった場合、それが地表へ上昇しやすくなります。
どちらの説が正しいとされていますか?
現在も議論が続いており、決定的な結論は出ていません。地域や現象によって、一方の説でうまく説明できる場合もあれば、もう一方の説が妥当な場合もあり、統合的な理解が進められています。
📸 フォトギャラリー