地球表面温度(GST)とは、陸上の地表付近の気温と海面水温を、それぞれの面積比で加重平均した指標です。この数値は、私たちの惑星がどれだけ熱を蓄えているかを示す重要な尺度であり、現代の気候変動を理解するための基盤となります。主に気象観測所や衛星から得られるデータに基づき、地球全体の平均的な温度変化が追跡されています。
科学的な合意によれば、近年の急激な温度上昇は人間活動による影響が極めて大きいとされています。過去の温度を推定するためには、直接的な計測が不可能な時代について、樹木の年輪やサンゴ、氷床コアなどの「プロキシデータ(代替指標)」が活用されており、これにより数千年から数百万年前まで遡った気候の歴史を明らかにすることが可能です。
![The blue line represents global surface temperature reconstructed over the last 2,000 years using proxy data from tree rings, corals, and ice cores.[1] The red line shows direct surface temperature measurements since 1880.[2]](/images/60/fe/60fe81c4236f131f90cced08a7e77f382af7fed7c7cf5d8a16b16b56b40cb06a.webp)
Key Facts
- 1.09°Cの上昇: 1850〜1900年の平均と比較して、2011〜2020年の地球表面温度は1.09°C上昇しました。
- 加速する温暖化: 1970年代以降の温度上昇ペースは、過去2,000年間のどの50年間よりも速い傾向にあります。
- 陸地の急上昇: 陸上の気温上昇(1.59°C)は、海面水温の上昇(0.88°C)よりも顕著に速く進んでいます。
- 記録的な猛暑: 2015年から2025年までの期間に、1850年以降の観測史上最も暑い11年すべてが含まれています。
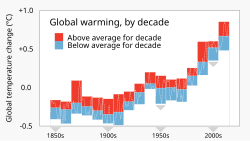
- 長期的な傾向: 直近4つの年代(ディケイド)は、それぞれがそれ以前のどの年代よりも高い平均温度を記録しています。
温度計測の手法とデータの信頼性
直接計測と計器記録
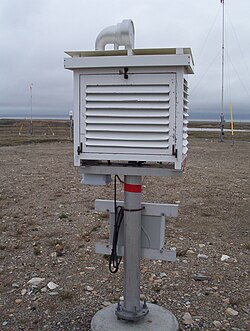
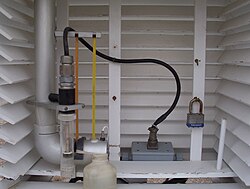
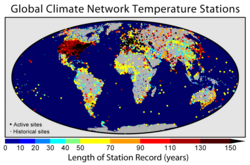
1850年から1880年頃にかけて、多くの地域で信頼性の高い温度計測が始まりました。これを「計器温度記録」と呼びます。世界で最も長い記録を持つのはイギリスの中部イングランド温度データ(1659年〜)です。地上では、直射日光や風の影響を排除した「スティーブンソン・スクリーン」などの専用設備を用いて正確な気温を測定しています。
高度な観測技術の導入
1950年代以降は、気象バルーンによるラジオゾンデや衛星観測が導入され、上層大気の温度監視が可能になりました。また、海洋の深層温度を測定することで、地球全体の熱含量をより正確に算出できるようになっています。最近では、海面水温ではなく海洋上の空気温度を用いた「GloSAT」データセットが登場し、1780年代まで遡る解析が可能になりました。
![A December 2025 article published in the Copernicus Programme's Earth System Science Data presented a GloSAT global surface air temperature dataset based on marine air temperature observations rather than the sea surface temperature measurements typically used. GloSAT extended back to the 1780s, earlier than 1850 covered by previous datasets.[89]](/images/a2/37/a237d40cf382b22c9435a9ba70aa3ca84562eaa9677fc112891212f09fd1875d.webp)
温度アノマリーという考え方
地球の温度データは、絶対的な温度(例:15°C)ではなく、「温度アノマリー(温度偏差)」として表現されるのが一般的です。これは、特定の基準期間(ベースライン。通常は30年間)の平均値からの差分を示すものです。例えば、基準期間の平均が15°Cで現在の測定値が17°Cであれば、アノマリーは「+2°C」となります。これにより、地域ごとの絶対温度の差に左右されず、変動の傾向を明確に把握できます。
温暖化の推移と最新の傾向
近年の急激な上昇
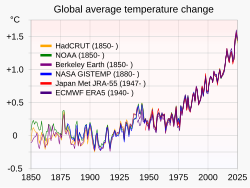
1940年から1975年頃までは比較的安定していましたが、1975年以降は10年あたり約0.15°Cから0.20°Cのペースで上昇し続けています。特に2023年は、1850〜1900年の平均より1.48°Cも高く、観測史上最も暑い年となりました。
地域的な差異と変動要因
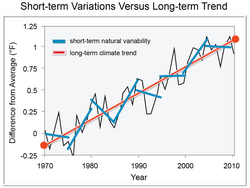
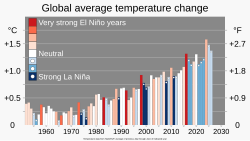
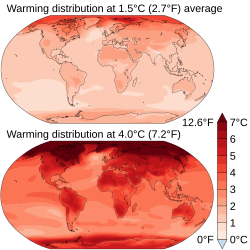
温暖化の影響は均一ではありません。特に北極圏では他の地域よりも激しく温度が上昇しており、陸地の方が海洋よりも温暖化が進んでいます。また、エルニーニョ・南方振動(ENSO)のような自然な内部変動により、年ごとの温度にばらつきが生じますが、長期的な上昇トレンドを妨げるものではありません。
![Over the last 50 years the Arctic has warmed the most, and temperatures on land have generally increased more than sea surface temperatures.[18]](/images/22/1b/221bbf02ab6f10ad744e7168dca69d59881c7ca3ee25ff55012e89952179cc10.webp)
![In recent decades, new high temperature records have substantially outpaced new low temperature records on a growing portion of Earth's surface.[52] Comparison shows seasonal variability for record increases.](/images/70/77/70770457a5fd02d19fa6cb7969fd8d8afb2e968f148c573e3b0b731c2c6ede1e.webp)
世界的な温暖化の可視化
多くの国々で同様の温暖化パターンが見られることは、データビジュアライゼーション(例:ウォーミング・ストライプス)によって明確に示されています。また、複数の独立した研究機関(NOAA、NASA GISS、ハドリーセンターなど)のデータセット間で極めて高い相関(99.29%以上)が認められており、温暖化の事実は科学的に強固に裏付けられています。
![Top graphic (comprehensive): 196 rows represent 196 countries, grouped by continent. Each row has 118 color-coded annual temperatures, showing 1901—2018 warming patterns in each region and country.[80][81] Bottom graphic (summary): global average 1901—2018.[82] Data visualization: warming stripes.](/images/eb/ae/ebae445e3f0778c2325dcb2127f7bfaafb1e0d1eaec448da0aac4b7b69b4d3ac.png)
地球の気候史:数百万年の視点から
数千年前から数万年前まで
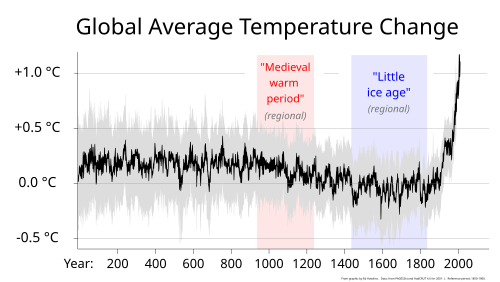
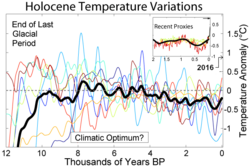
過去2,000年の復元データによれば、中世温暖期や小氷期といった現象は地球規模で同時に起きたものではなく、地域的な変動であったことが分かっています。また、過去12,000年のホロセーン(完新世) epochにおいては、比較的安定した気候が続いていましたが、現代の急上昇はその安定性を大きく逸脱しています。
氷床コアと地質学的証拠
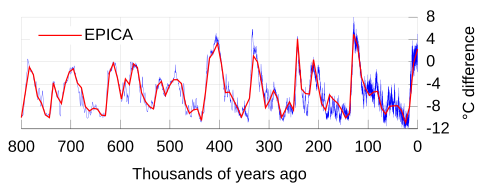
南極のEPICA氷床コアなどのデータは、過去80万年間にわたる温度変動を記録しています。さらに、深海堆積物の酸素同位体分析などの地質学的証拠を用いることで、過去500万年にわたる氷河周期と気候の変動をモデル化することが可能です。
![Ice core data location[98]](/images/34/cd/34cd8e9d05c08403dbe3bce95f92167f5b61c9771d42e967dc0bdfb00a41c9b6.png)
![Reconstruction of the past 5 million years of climate history, based on oxygen isotope fractionation in deep sea sediment cores (serving as a proxy for the total global mass of glacial ice sheets), fitted to a model of orbital forcing (Lisiecki and Raymo 2005)[111] and to the temperature scale derived from Vostok ice cores following Petit et al. (1999).[112]](/images/20/0a/200a10a0795bfd4605faef25f4346b431dd8fe4c2fa70340dd3b2c53f7ecf579.png)
まとめ:温度変動のデータ概要
| 項目 | 詳細・数値 | 備考 |
|---|---|---|
| 1850-1900年比の上昇幅 | 1.09 °C (2011-2020年平均) | 地球全体(陸域+海域) |
| 陸域の温度上昇 | 1.59 °C | 海洋よりも上昇が速い |
| 海面水温の上昇 | 0.88 °C | 熱容量が大きいため上昇は緩やか |
| 最近の上昇ペース | 0.15 〜 0.20 °C / 10年 | 1975年以降の傾向 |
| 最暖年 (2023年) | +1.48 °C | 1850-1900年平均比 |
Frequently Asked Questions
温度アノマリーとは何ですか?
絶対的な温度ではなく、特定の基準期間(例:1951〜1980年)の平均温度からの「差」のことです。これにより、場所による温度差を排除して、地球全体の温度がどれだけ上昇または下降したかという傾向を正確に把握できます。
過去の温度をどうやって知ることができるのですか?
直接的な温度計がない時代は、プロキシデータ(代替指標)を使用します。具体的には、年輪の幅や密度、サンゴの骨格、氷床コアの中に閉じ込められた気泡や同位体などを分析することで、当時の気温や気候を推定します。
エルニーニョ現象は温暖化と関係がありますか?
エルニーニョは自然な内部変動であり、一時的に世界平均気温を押し上げる要因となります。一方でラニーニャ現象は一時的に温度を下げる傾向にあります。これらは短期的な変動であり、長期的な温暖化トレンドとは別の現象です。
陸地と海で温度上昇に差があるのはなぜですか?
一般的に陸地は海洋よりも比熱が小さいため、温まりやすく冷めやすい性質があります。そのため、地球温暖化の影響は海面水温よりも陸上の気温に顕著に現れ、上昇幅が大きくなる傾向があります。
観測データの信頼性は確保されていますか?
はい。都市化によるヒートアイランド現象や観測所の設置場所の問題について、Berkeley Earthなどの独立したグループが検証を行っています。その結果、これらの要因が全体の温暖化トレンドに大きなバイアスを与えていないことが確認されており、主要な研究機関のデータ間で高い一致が見られます。
References
- PAGES 2k Consortium (2019). "Consistent multidecadal variability in global temperature reconstructions and simulations over the Common Era". Nature Geoscience. 12 (8): 643–649. :2019NatGe..12..643P. :10.1038/s41561-019-0400-0. 1752-0894. 6675609. 31372180.
- "Global Annual Mean Surface Air Temperature Change". . Retrieved 23 February 2020.
- Brohan, P.; Kennedy, J. J.; Harris, I.; Tett, S. F. B.; Jones, P. D. (2006). "Uncertainty estimates in regional and global observed temperature changes: a new dataset from 1850". 111 (D12): D12106. :2006JGRD..11112106B. 10.1.1.184.4382. :10.1029/2005JD006548. 250615.
{{}}: Cite uses deprecated parameter|citeseerx=() - "Remote Sensing Systems". www.remss.com. Retrieved 19 May 2022.
- World of change: Global Temperatures Archived 2019-09-03 at the The global mean surface air temperature for the period 1951–1980 was estimated to be 14 °C (57 °F), with an uncertainty of several tenths of a degree.
- "Solar System Temperatures". National Aeronautics and Space Administration (NASA). 4 September 2023.
{{}}: CS1 maint: deprecated archival service () (link to NASA graphic) - "Tracking breaches of the 1.5 °C global warming threshold". Copernicus Programme. 15 June 2023. Archived from the original on 14 September 2023.
- (2021). "Summary for Policymakers" (PDF). The Physical Science Basis. Contribution of Working Group I to the Sixth Assessment Report of the Intergovernmental Panel on Climate Change. .
- NOAA National Centers for Environmental Information, Monthly Global Climate Report for Annual 2022, published online January 2023, Retrieved on July 25, 2023 from https://www.ncei.noaa.gov/access/monitoring/monthly-report/global/202213.
- IPCC, 2021: Annex VII: Glossary [Matthews, J.B.R., V. Möller, R. van Diemen, J.S. Fuglestvedt, V. Masson-Delmotte, C. Méndez, S. Semenov, A. Reisinger (eds.)]. In Climate Change 2021: The Physical Science Basis. Contribution of Working Group I to the Sixth Assessment Report of the Intergovernmental Panel on Climate Change [Masson-Delmotte, V., P. Zhai, A. Pirani, S.L. Connors, C. Péan, S. Berger, N. Caud, Y. Chen, L. Goldfarb, M.I. Gomis, M. Huang, K. Leitzell, E. Lonnoy, J.B.R. Matthews, T.K. Maycock, T. Waterfield, O. Yelekçi, R. Yu, and B. Zhou (eds.)]. Cambridge University Press, Cambridge, United Kingdom and New York, NY, USA, pp. 2215–2256, doi:10.1017/9781009157896.022.


📸 フォトギャラリー