生命体は、単一の分子や遺伝子の集まりではなく、無数の要素が複雑に絡み合った巨大なネットワークとして機能しています。システム生物学とは、こうした生物学的システムを計算科学や数学的な手法を用いて解析し、モデル化する学際的な研究分野です。従来の生物学が個別の要素を詳細に調べる「還元主義」に基づいていたのに対し、システム生物学は全体としての振る舞いに注目する「ホリズム(全体論)」的な視点を重視します。
この分野では、生物学者だけでなく、化学者、数学者、物理学者、エンジニアが協力し、定量的な分子測定データと精緻な数学モデルを融合させます。これにより、遺伝子、タンパク質、代謝物がどのように相互作用し、細胞の活動や個体の特性(表現型)を決定づけているのかを明らかにすることを目指しています。
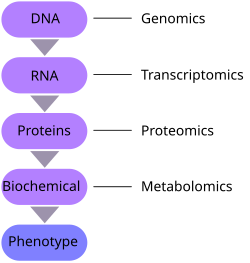
Key Facts
- 統合的視点: 個別の要素ではなく、システム全体の動的な相互作用を解析する。
- 学際的アプローチ: 数学、物理学、計算科学などの手法を生物学に導入している。
- 創発特性の解明: 単一の部品からは予測できない、システム全体として現れる「創発的な性質」の発見を目的とする。
- データ駆動型: オミクス解析などの大規模データと数理モデルを組み合わせて解析を行う。
還元主義からホリズムへのパラダイムシフト
生物学の歴史において、多くの成果は「還元主義」的なアプローチによってもたらされました。これは、複雑なシステムを最小単位に分解して理解しようとする手法です。しかし、構成要素をすべて特定したとしても、それらがどう組み合わさって生命現象という「全体」を作り出しているのかを説明することは困難でした。
システム生物学は、この限界を打破するために「統合」という概念を導入しました。複数の構成要素を同時に観測し、それらの関係性を数学的に記述することで、分子レベルの挙動がどのように生理学的なプロセスへと結びつくのかというギャップを埋めようとしています。
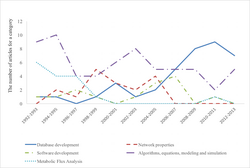
システム生物学の解析手法とモデル化
システム生物学では、解析の方向性によって大きく2つのアプローチに分けられます。一つは、既知の構成要素からシステムを構築する「ボトムアップアプローチ」、もう一つは、システム全体の挙動から個別の要素の役割を推論する「トップダウンアプローチ」です。
数理モデルの役割と種類
生物学的な現象を再現するために、さまざまな形式のモデルが活用されています。例えば、遺伝子制御ネットワークのオン・オフを単純化したブールモデルや、化学反応速度に基づいた微分方程式モデルなどが挙げられます。
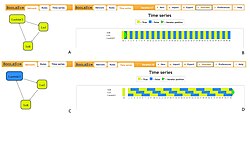
ブールモデルは、複雑なネットワークの論理的な挙動をシミュレーションするのに適しており、特定のツール(BooleSimなど)を用いて遺伝子の促進や抑制の関係を可視化できます。
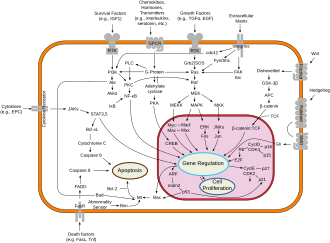
一方で、より定量的な解析が必要な場合は、ミカエリス・メンテン式などの反応速度論を用いた微分方程式が用いられます。これにより、タンパク質の濃度変化やフィードバックループの動態を精密に記述することが可能です。
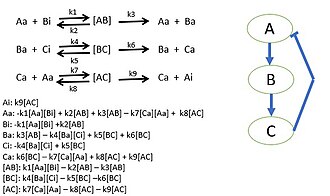
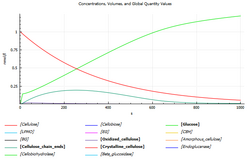
また、酵素による基質変換などの代謝プロセスを時間軸に沿って解析することで、多段階の反応系における物質の変化を追跡することもできます。
実社会への応用展開
システム生物学の知見は、医療や産業など幅広い分野で応用されています。
- がん研究: がん細胞の複雑なシグナル伝達ネットワークを解析し、治療標的の特定や薬剤耐性のメカニズム解明に役立てています。
- 創薬・薬剤開発: 薬物が標的以外の分子に与える影響(オフターゲット効果)を予測し、より安全で効率的な新薬開発を推進しています。
- 食の安全と品質: 代謝ネットワークの解析を通じて、食品の品質管理や安全性の向上を図っています。
- 環境システム生物学: 生物と環境の相互作用をモデル化し、環境問題の解決や生態系の保全に寄与しています。
システム生物学の概要まとめ
| 項目 | 還元主義(従来) | システム生物学(統合的) |
|---|---|---|
| 視点 | 個別の構成要素への分解 | システム全体の相互作用 |
| アプローチ | 分析的(分解) | 統合的(合成) |
| 主な手法 | 単一分子・遺伝子の解析 | 数理モデル、オミクス解析、計算科学 |
| 目的 | 構成要素の特定 | 創発特性と動的挙動の解明 |
今後の課題とAIの活用
システム生物学には、依然として多くの技術的課題が存在します。特に、生物学的データの膨大さと不均一性、そしてモデルのパラメータ推定の困難さが挙げられます。これらの課題を解決するために、人工知能(AI)の導入が進んでいます。機械学習を用いることで、複雑なデータセットから未知のパターンを抽出したり、より精度の高い予測モデルを構築したりすることが可能になっています。
Frequently Asked Questions
システム生物学とバイオインフォマティクスの違いは何ですか?
バイオインフォマティクスは主に生物学的データの管理や解析のためのツールやアルゴリズムの開発に焦点を当てていますが、システム生物学はそのデータを用いて生物システム全体の挙動をモデル化し、理論的に理解することを目指すより広範なアプローチを指します。
「創発特性」とは具体的にどのようなものですか?
個々のタンパク質や遺伝子の性質だけを見ても予測できない、システム全体として現れる機能のことです。例えば、複数の分子が組み合わさることで生じる「生物学的時計(概日リズム)」や、特定の刺激に対する細胞全体の応答などがこれに当たります。
ボトムアップアプローチとトップダウンアプローチの使い分けは?
構成要素の相互作用が詳細に分かっている場合は、それらを組み合わせて挙動を予測するボトムアップ法が有効です。逆に、現象は分かっているが原因となる分子ネットワークが不明な場合は、大規模データから構造を推論するトップダウン法が適しています。
システム生物学はどのようにして新薬の開発に貢献しますか?
単一の標的に作用させるのではなく、ネットワーク全体のバランスを考慮した治療戦略を立てることができます。これにより、副作用の軽減や、複数の経路を同時に遮断する併用療法の最適化が可能になります。
References
- Tavassoly, Iman; Goldfarb, Joseph; Iyengar, Ravi (2018-10-04). "Systems biology primer: the basic methods and approaches". Essays in Biochemistry. 62 (4): 487–500. :10.1042/EBC20180003. 0071-1365. 30287586. 52922135.
- MacLeod, Miles; Nersessian, Nancy J. (2016-10-01). "Interdisciplinary problem- solving: emerging modes in integrative systems biology". European Journal for Philosophy of Science. 6 (3): 401–418. :10.1007/s13194-016-0157-x. 1879-4920.
- Veenstra, Timothy D. (February 2021). "Omics in Systems Biology: Current Progress and Future Outlook". Proteomics. 21 (3–4) 2000235. :10.1002/pmic.202000235. 1615-9853. 33320441.
- Longo, Giuseppe; Montévil, Maël (2014). Perspectives on Organisms: Biological time, Symmetries and Singularities. Lecture Notes in Morphogenesis. Berlin, Heidelberg: Springer Berlin Heidelberg. :10.1007/978-3-642-35938-5. .
- Sauer, Uwe; Heinemann, Matthias; Zamboni, Nicola (2007-04-27). "Getting Closer to the Whole Picture". Science. 316 (5824): 550–551. :2007Sci...316..550S. :10.1126/science.1142502. 0036-8075. 17463274.
- Noble, Denis (2009). The music of life: biology beyond the genome (Repr ed.). Oxford: Oxford Univ. Press. .
- Kholodenko, Boris N.; Bruggeman, Frank J.; Sauro, Herbert M. (2005). "Mechanistic and modular approaches to modeling and inference of cellular regulatory networks". In Alberghina, Lila; Westerhoff, H.V. (eds.). Systems Biology. Berlin/Heidelberg: Springer-Verlag. pp. 143–159. :10.1007/b136809. .
- Romualdi, Chiara; Lanfranchi, Gerolamo (2009). "Statistical Tools for Gene Expression Analysis and Systems Biology and Related Web Resources". In Krawetz, Stephen (ed.). Bioinformatics for Systems Biology. Totowa, NJ: Humana Press. pp. 181–205. :10.1007/978-1-59745-440-7_11. .
- Bruggeman, Frank J.; Westerhoff, Hans V. (January 2007). "The nature of systems biology". Trends in Microbiology. 15 (1): 45–50. :2007TrMic..15...45B. :10.1016/j.tim.2006.11.003. 17113776.
- Dhillon, Bhavjinder K.; Smith, Maren; Baghela, Arjun; Lee, Amy H. Y.; Hancock, Robert E. W. (2020-07-30). "Systems Biology Approaches to Understanding the Human Immune System". Frontiers in Immunology. 11 1683. :10.3389/fimmu.2020.01683. 1664-3224. 7406790. 32849587.
📸 フォトギャラリー