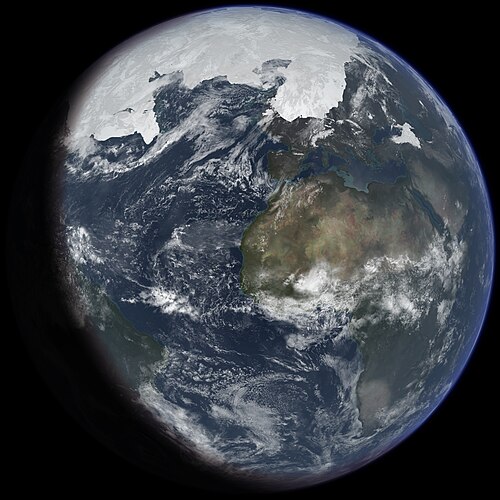
地球の歴史において、表面や大気の温度が著しく低下し、大陸氷床や極地氷床、あるいは山岳氷河が拡大する期間を氷河時代と呼びます。地球の気候は、恒久的な氷が存在しない「温室状態(グリーンハウス)」と、氷河が広がる「氷室状態(アイスハウス)」の間を長い時間をかけて行き来してきました。
現在、私たちは約3,400万年前に始まった「新第三紀後期氷河時代」という大きな氷室状態の中にあります。この長い期間の中には、さらに寒冷な「氷期」と、比較的温暖な「間氷期」が繰り返されており、私たちが生きる現在は「完新世」と呼ばれる間氷期にあたります。
Key Facts
- 現在の位置づけ: 地球は3,400万年前から続く氷室状態にあり、現在は約11,700年前から続く間氷期(完新世)に位置している。
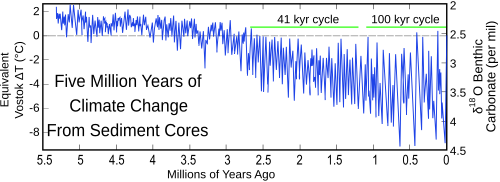
- 第四紀氷河時代: 約258万年前に始まり、4万年または10万年周期で氷期と間氷期を繰り返している。
- 主要な原因: 地球の公転軌道の変化(ミランコビッチ・サイクル)が、日射量の分布を変えることで氷床の拡大・後退を促す。
- 海面への影響: 氷床が最大となった時期には、海水が陸上に氷として固定されるため、海面が約120メートル低下した。
- 人類の影響: 温室効果ガスの増加により、本来訪れるはずの次なる氷期が大幅に遅れる、あるいは回避される可能性がある。
氷河研究の歩みと証拠
氷河時代の概念は、地質学的な観察から発展しました。19世紀初頭、デンマーク・ノルウェーの地質学者イェンス・エスマークは、海抜に近い場所にあるモレーン(氷河が運んだ堆積物)が、高山の氷河付近に見られるものと酷似していることを発見しました。彼は、地球の軌道変化による気候変動が世界的な氷河時代を引き起こしたという先駆的な理論を提唱しました。
こうした理論を裏付ける証拠として、広範な緯度にわたって堆積した地層のシーケンスが挙げられます。これらの堆積記録を分析することで、数百万年にわたる氷期と間氷期の変動サイクルを明らかにすることが可能となりました。

第四紀氷河時代のサイクル
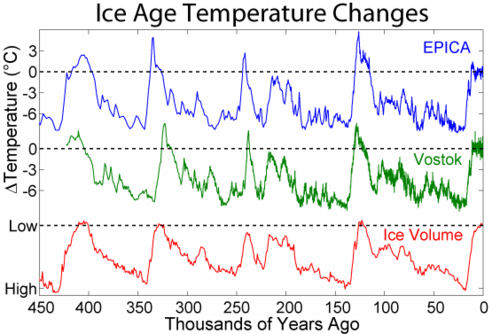
約258万年前に始まった第四紀氷河時代では、北半球を中心に氷床の拡大と後退が繰り返されてきました。特に直近の40万年間は、氷床コアの分析により、大気組成や温度、氷の量と軌道要素の変化が密接に連動していることが分かっています。
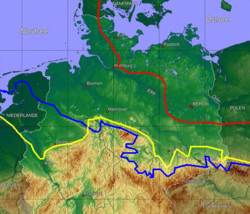
直近の大きな流れとしては、11万5,000年前に前回の間氷期が終わり、「最終氷期(LGP)」へと移行しました。その中でも2万6,000年前から2万年前にかけては、氷床が最大範囲に達した「最終氷期最盛期(LGM)」と呼ばれます。その後、12,800年から11,700年前にかけて「ヤンガードリアス期」という急激な寒冷期を経て、現在の完新世へと至りました。
氷河時代を引き起こす要因
ミランコビッチ・サイクル(軌道要素の変化)
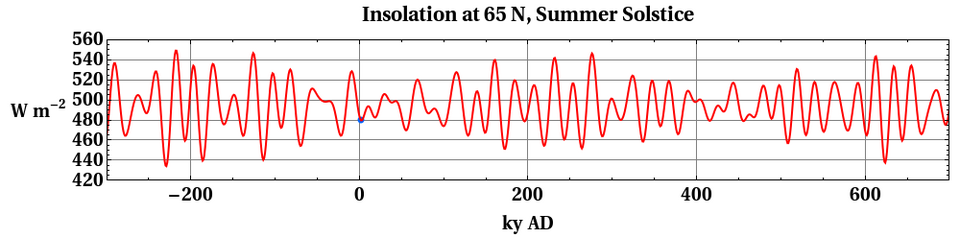
氷河時代の周期性を説明する最も有力な理論が、地球の公転軌道の変化です。具体的には、太陽との距離の変化(離心率)、地軸の傾き(黄道傾斜角)、および地軸の歳差運動の3つが組み合わさり、地球に届く日射量の分布を変化させます。特に夏の日射量が低下し、前冬の積雪が溶けきらなくなった時に氷床が拡大し始めると考えられています。
海洋循環とフィードバック
海洋の熱輸送の変化も重要な役割を果たします。例えば、氷床の拡大で海面が低下すると、ベリング海峡などの海路が制限され、北大西洋の熱塩循環(深層循環)が変化します。これにより北極圏への熱輸送量が増え、氷が融解して海面が再び上昇するというサイクルが生まれます。
![Diagram of key climate-carbon cycle feedbacks linking Quaternary climates and temperatures, Generalized Milankovitch Theory (GMT), to atmospheric CO2 and ice sheets.[53] Positive feedbacks amplify and negative feedbacks dampen environmental change, with slow-acting responses shown as dashed arrows.](/images/de/b0/deb00848115fd3062c54e92f58e0e13f45ab54aecd4f50161f2511919f003d68.png)
地質学的要因:チベット高原の隆起
プレートテクトニクスによるチベット高原の隆起も、地球規模の冷却に寄与したという説があります。高地が雪線を超えて氷に覆われると、アルベド(太陽光の反射率)が大幅に上昇し、エネルギーが宇宙へ反射されるため、地球全体の温度を押し下げる要因となります。
氷河が地球に残した影響
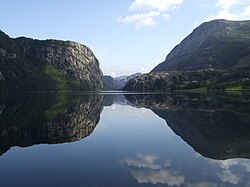
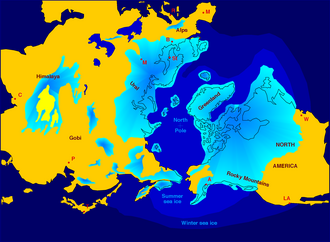
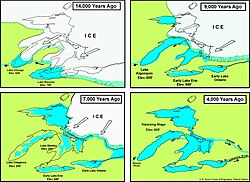
巨大な氷床は地表を激しく削り取り、独特の地形を形成しました。北米では、厚さ3〜4kmに達する氷床が北緯45度付近まで南下し、その融解過程で巨大な氷河湖が形成されました。また、スカンジナビア半島に見られるフィヨルドや多くの湖沼も、氷河による浸食と堆積の結果です。
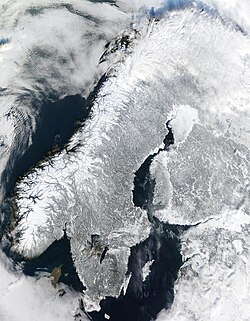
今後の展望と人類の影響
自然なサイクルに従えば、次の氷期は数万年以内に訪れるはずです。しかし、現代の人類が排出した大量の温室効果ガスによる「人為的強制力」が、ミランコビッチ・サイクルによる冷却効果を上回ると予測されています。このため、次なる氷河時代の到来は大幅に遅れるか、あるいは完全に回避される可能性があります。
| 期間・名称 | 開始時期 | 主な特徴 |
|---|---|---|
| 新第三紀後期氷河時代 | 約3,400万年前 | 地球が「氷室状態」に入った長期的な期間 |
| 第四紀氷河時代 | 約258万年前 | 氷期と間氷期が周期的に繰り返される時代 |
| 最終氷期最盛期 (LGM) | 2.6万〜2万年前 | 氷床が最大範囲に達し、海面が激減した時期 |
| 完新世 (Holocene) | 約11,700年前〜現在 | 現在の温暖な間氷期 |
Frequently Asked Questions
氷河時代とは具体的にどのような状態のことですか?
地球の表面温度が低下し、北極や南極などの極地だけでなく、大陸の広い範囲に氷床が広がったり、高い山々に氷河が形成されたりする期間を指します。
なぜ氷河時代は周期的に繰り返されるのですか?
主に地球の公転軌道の形や地軸の傾きが周期的に変化する「ミランコビッチ・サイクル」により、季節ごとの日射量が変わることが大きな要因とされています。
現在の私たちは氷河時代の中にいるのでしょうか?
はい。広義には3,400万年前から続く氷室状態(アイスハウス)の中にあり、その中の比較的暖かい期間である「間氷期」に位置しています。
氷河時代になると海面はどうなりますか?
大量の海水が陸上で氷として蓄積されるため、海面は大幅に低下します。例えば、最終氷期最盛期には現在より約120メートル低かったと推定されています。
人間活動によって次の氷河時代は止まる可能性がありますか?
その可能性が高いと考えられています。温室効果ガスの増加による温暖化の影響が、軌道要素による冷却効果を打ち消し、次なる氷期の到来を遅らせる、あるいは回避させると予測されています。
References
- Rémy F, Testut L (2006). "Mais comment s'écoule donc un glacier ? Aperçu historique" (PDF). Comptes Rendus Geoscience (in French). 338 (5): 368–385. :2006CRGeo.338..368R. :10.1016/j.crte.2006.02.004. Archived (PDF) from the original on 2012-04-26. Retrieved 2009-06-23. Note: p. 374
- Martel, Pierre (1898). "Appendix: Martel, P. (1744) An account of the glacieres or ice alps in Savoy, in two letters, one from an English gentleman to his friend at Geneva; the other from Pierre Martel, engineer, to the said English gentleman". In Mathews, C.E. (ed.). The annals of Mont Blanc. London: Unwin. p. 327. See () for a full bibliography
- Krüger, Tobias (2013). Discovering the Ice Ages. International Reception and Consequences for a Historical Understanding of Climate (German edition: Basel 2008). Leiden, Netherlands: Brill. p. 47. . 968318929.
- , pp. 78–83
- , p. 150
- , pp. 83, 151
- Goethe, Johann Wolfgang von: Geologische Probleme und Versuch ihrer Auflösung, Mineralogie und Geologie in Goethes Werke, Weimar 1892, , book 73 (WA II, 9), pp. 253, 254.
- , p. 83
- , p. 38
📸 フォトギャラリー